Most people building a data analyst portfolio start with a dataset and end with a dashboard. Few can explain, under questioning, why they made specific decisions along the way and that gap is usually what separates a finished project from convincing evidence. IQlancer article treats data analyst projects as something closer to a legal case than a school assignment: every claim needs support, every method needs a reason, and every chart needs to answer an actual business question.
What follows is a practical framework for choosing, building, documenting, and defending projects so they hold up when someone finally asks, “Walk me through this.”
What Makes a Data Analyst Project Interview-Worthy?
A project earns interview credibility through the reasoning behind it, not its visual polish this section resets the evaluation criteria before any project ideas are introduced, so the rest of the article is read the right way.
It’s tempting to judge a data analyst project by surface signals: how many charts it has, how many tools it name-drops, how large the dataset is, or how sleek the dashboard looks. None of these are reliable indicators of analytical capability. A five-tab Power BI dashboard built from a clean, pre-packaged Kaggle file can still represent almost no independent thinking, while a plain three-query SQL analysis of a messy, realistic dataset can demonstrate real judgment.
What actually distinguishes a credible project is the presence of the full analytical chain: a defined business problem, a data source with real quality issues, a documented cleaning and validation process, an analytical method chosen for a reason, findings that are specific rather than descriptive, a recommendation connected to those findings, and documentation clear enough that a stranger could follow the logic.
Consider the difference between two ways of describing the same piece of work:
- “Showing that I used Power BI” this is a tool statement. It says nothing about judgment.
- “Showing that I used Power BI to answer a meaningful business question” this is evidence. It implies a decision was involved somewhere.
Employers hiring analysts are not primarily hiring tool operators. Recent breakdowns of real job descriptions show that Excel, SQL, Power BI, and Python dominate the requirements list, but the postings consistently frame these tools around outcomes reporting, KPI ownership, and translating findings into decisions rather than tool usage in isolation, according to AccioJob’s analysis of 328 real data analytics job descriptions.
A project is interview-worthy when it could plausibly be mistaken for a piece of real workplace output, not a class exercise.
What Recruiters and Employers Look For in Data Analyst Projects
Before choosing a single project idea, it helps to know what actually shows up across current job postings this section separates commonly requested skills from role-specific extras so project planning is grounded in real demand rather than guesswork.
Based on an analysis of 328 real data analytics job descriptions, Excel appeared in 81% of postings, SQL in 60%, Power BI in 43%, and Python in 41%, with communication and general data-analysis ability following close behind. A separate breakdown of a year of postings put SQL at the top with Excel and Python close behind, per datanerd.tech’s research on data analyst skills. These numbers will not match every employer, every country, or every industry a fintech listing and a marketing-agency listing can look very different but the pattern of “SQL plus a spreadsheet plus one BI tool” as the baseline is consistent across multiple independent sources.
It’s worth separating requirements into rough tiers, understanding that this grouping is a planning aid, not a universal hiring rule:
| Tier | Typical Skills | Notes |
|---|---|---|
| Commonly Requested | SQL, Excel, data visualization, basic statistics, communication | Appear across most entry- and mid-level postings |
| Frequently Useful | Power BI or Tableau, data cleaning, KPI analysis | One BI tool is usually enough; employers rarely require all of them |
| Role-Specific | Python/R, A/B testing, forecasting, cohort analysis | More common in product, growth, or senior analyst roles |
| Optional / Differentiating | dbt, cloud warehouses, GA4, AI-assisted workflows | Can set a candidate apart but rarely a baseline requirement |
One industry breakdown of a typical analyst’s week estimated roughly 40% of time spent pulling and cleaning data with SQL and Excel, 30% on dashboards and reporting, and the remainder on ad-hoc analysis and stakeholder communication, according to Jobright’s 2026 data analyst job strategy guide a useful reminder that data cleaning and communication deserve as much project time as the analysis itself.
Some postings frame Python as a hard requirement; others treat it as a nice-to-have layered on top of SQL and a dashboard tool, according to KORE1’s breakdown of data analyst job description templates. Treat any specific percentage as directional, since methodology and sample size vary between sources.
Data Analyst Project vs. Tutorial Project
The single biggest reason portfolios fail in interviews is that they read as completed tutorials rather than original analysis this comparison exists to help readers self-diagnose before they invest more time in the wrong kind of project.
This is one of the most important distinctions in this entire article, and it’s the one most beginner guides skip.
Tutorial Project
- Follows a course’s or video’s exact instructions
- Uses a dataset that is already clean and pre-labeled
- Recreates a dashboard someone else designed
- Has little or no stated business context
- Comes with minimal or no documentation
- The creator can describe what was built but struggles to explain why
Stronger Portfolio Project
- Starts from a defined business question, not a dataset
- Works with data that has real quality problems: missing values, inconsistent formats, duplicate records
- Involves analytical decisions which metric to use, how to handle outliers, which time window to analyze
- Explains the methodology in plain language
- Produces findings specific enough to be wrong (and therefore checkable)
- Includes a business recommendation tied to those findings
- States its own limitations honestly
- Can be defended, line by line, in an interview
The practical test is simple: if a candidate were asked “why did you choose this approach instead of an alternative one?” and the honest answer is “that’s what the tutorial did,” the project is not yet portfolio-ready. This doesn’t mean tutorials are worthless they’re a legitimate way to learn a tool. It means a tutorial completed exactly as instructed is a learning artifact, not hiring evidence.
The Project Intelligence Framework
Every project in this article should be evaluated against a single repeatable structure introducing it once here means every later project idea can be checked against the same standard instead of being described inconsistently.
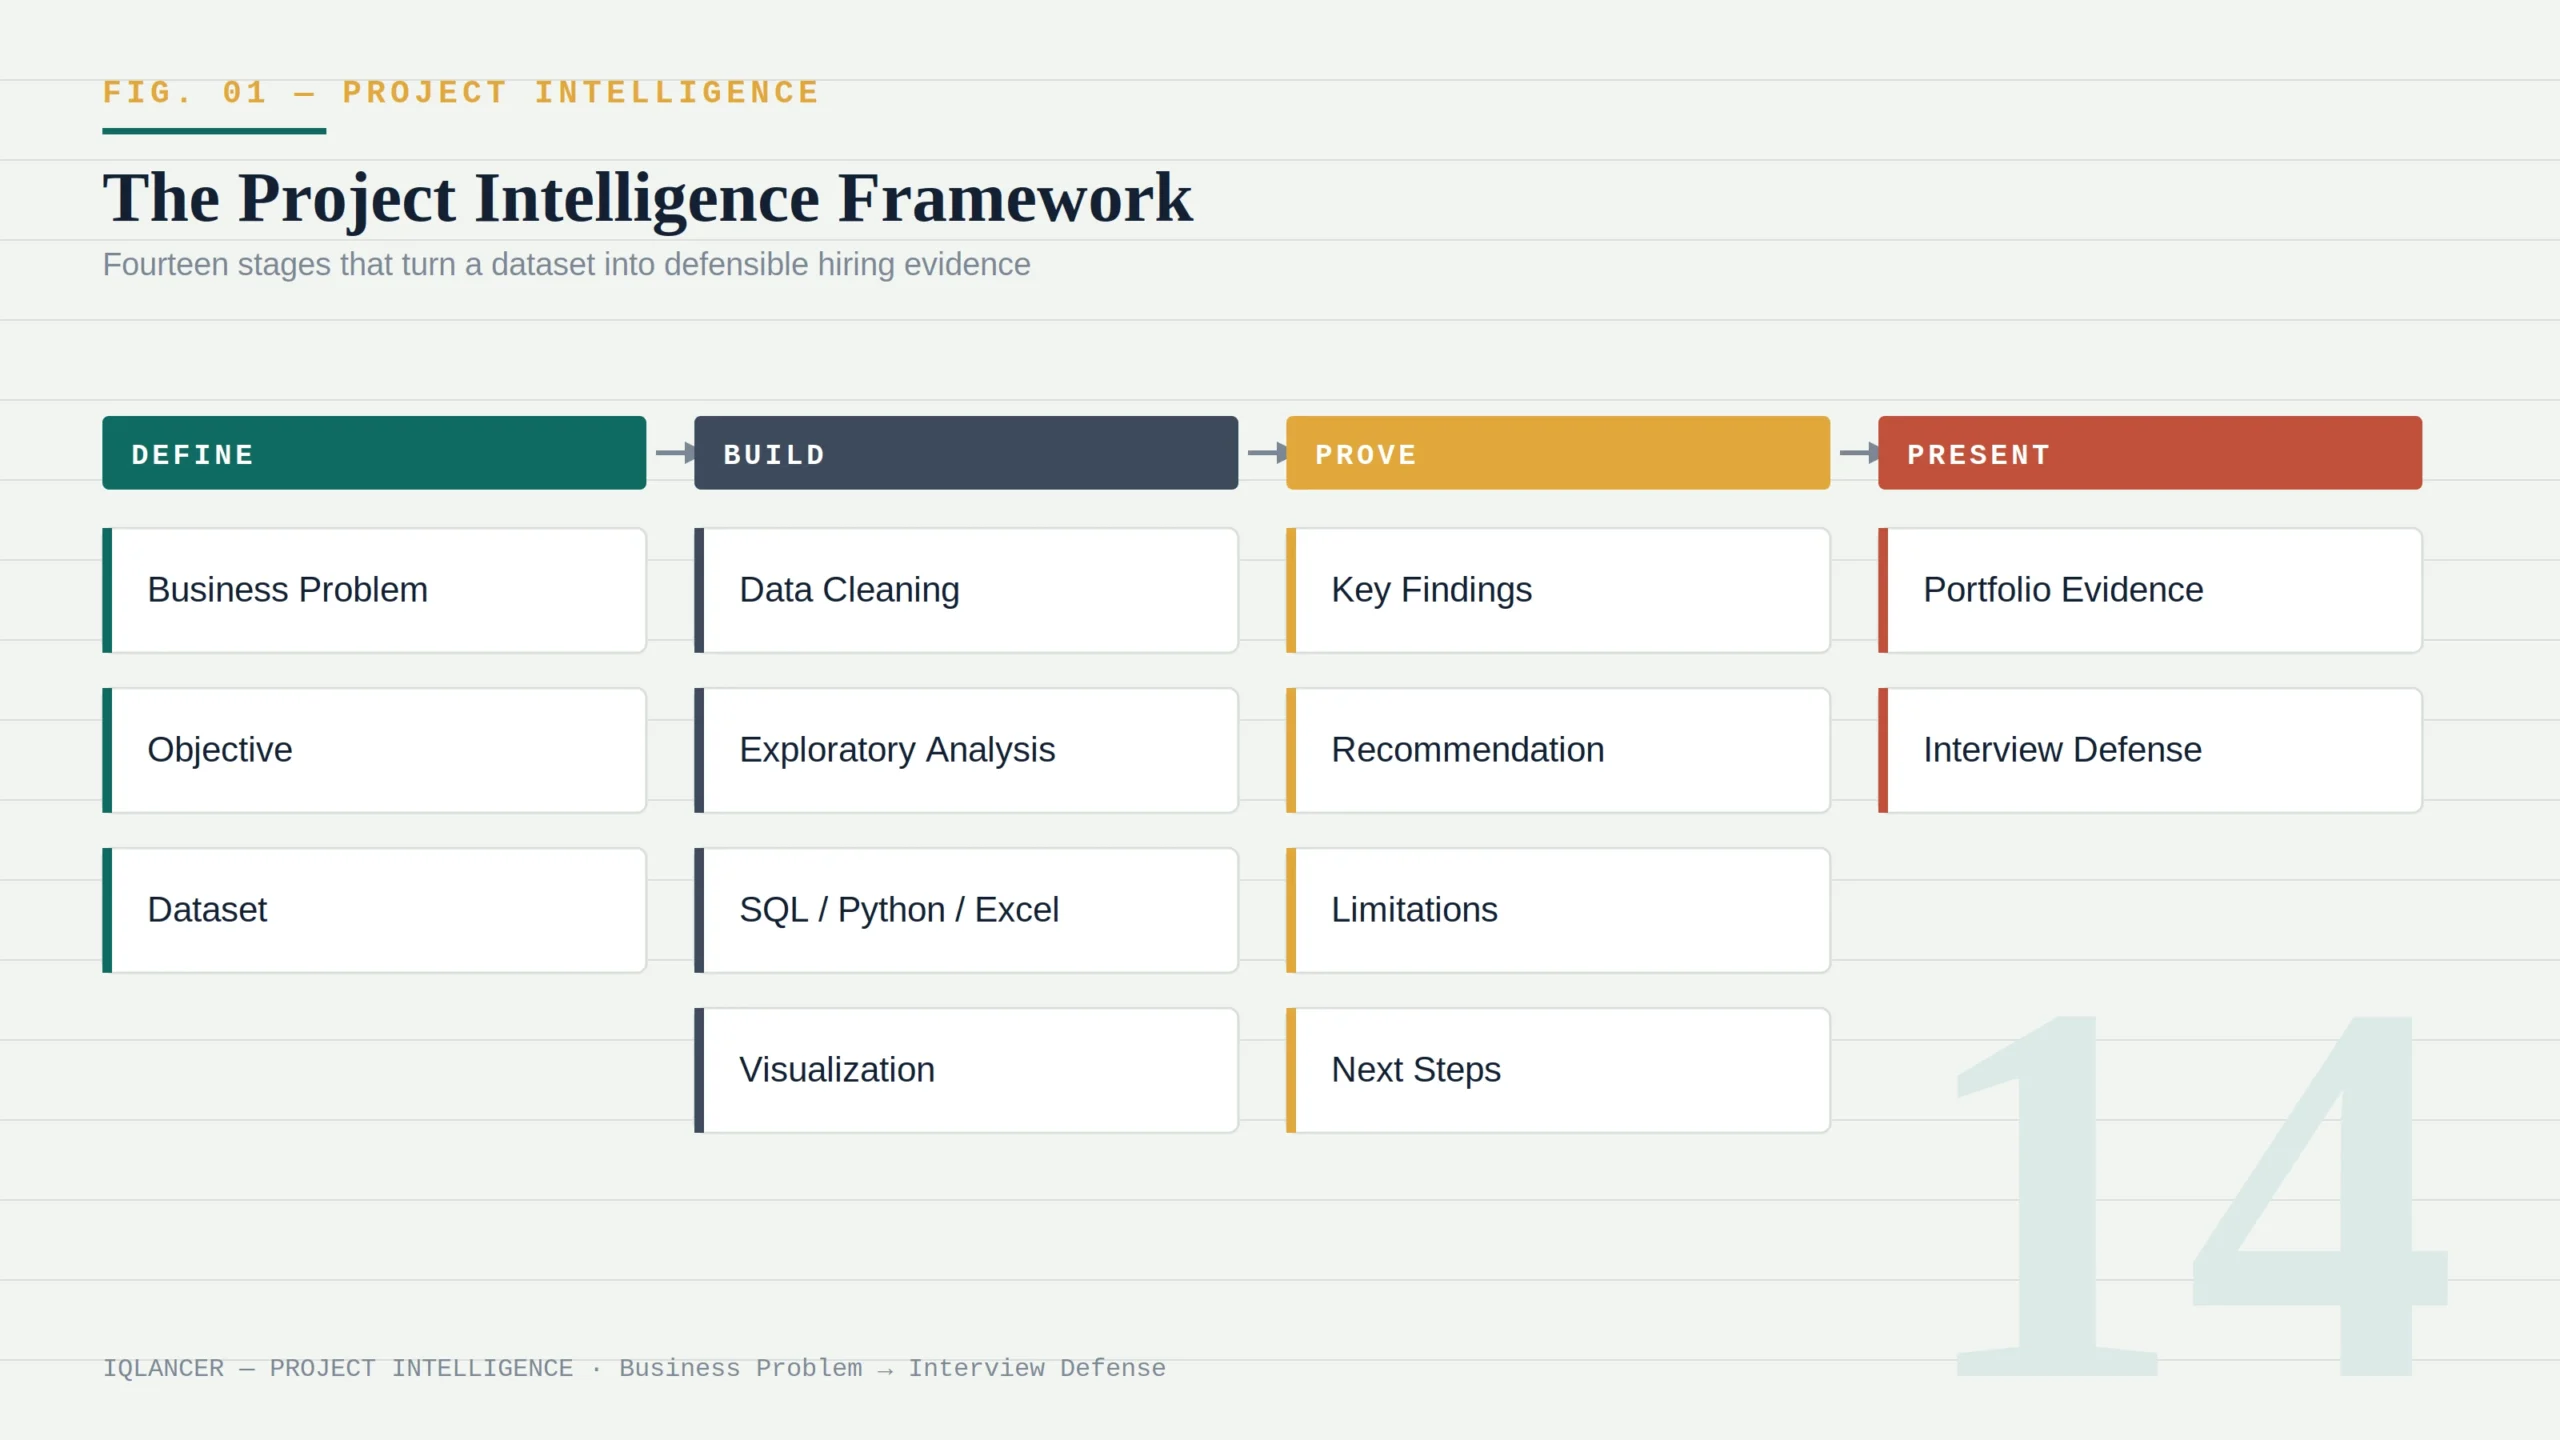
- Business Problem: The real-world question a stakeholder would actually ask (e.g., “Why did repeat purchases fall last quarter?”).
- Objective: A translation of that question into something measurable.
- Dataset: The specific data source(s) used, with a rationale for why they fit the objective.
- Data Cleaning: The documented process of handling missing values, duplicates, inconsistent formats, and outliers.
- Exploratory Analysis: Initial inspection distributions, correlations, obvious anomalies before committing to a method.
- SQL/Python/Excel Analysis: The actual technical work: queries, scripts, or formulas that answer the objective.
- Visualization: Charts or dashboards chosen because they communicate the finding clearly, not because they look impressive.
- Key Findings: Specific, falsifiable statements not vague summaries like “sales varied by region.”
- Business Recommendation: What a decision-maker should do differently based on the findings.
- Limitations: What the analysis could not account for sample size, missing variables, time constraints.
- Next Steps: What additional data or analysis would strengthen the conclusion.
- Portfolio Evidence: How the work is packaged README, notebook, dashboard link, screenshots.
- Interview Defense: The candidate’s ability to explain and justify every prior stage without notes.
A project that skips the last four stages is common. A project that includes all fourteen is rare and that rarity is exactly what makes it stand out.
How Many Data Analyst Projects Do You Actually Need?
There is no universal number, and any article claiming otherwise is guessing this section replaces a fake rule with a portfolio strategy based on differentiation rather than volume.
There’s no researched, universal answer to “how many projects should I have.” What can be said with more confidence is that 3–4 strong, clearly differentiated projects tend to represent a candidate’s range better than 10–15 shallow ones, because a reviewer skimming a portfolio in a few minutes is looking for variety of thinking, not repetition of the same dashboard style with a different dataset swapped in.
A reasonable portfolio composition to aim for, adjusted to the target role:
- A SQL-heavy project demonstrating querying, joins, and data validation
- A BI/dashboard project (Power BI or Tableau) demonstrating visualization and stakeholder-facing reporting
- A Python or statistical analysis project demonstrating deeper analytical reasoning
- An end-to-end business analysis project that combines all of the above around one coherent business problem
This is a strategy, not a rule. A candidate targeting a BI-heavy reporting role may reasonably lean more heavily on dashboard projects; a candidate targeting a product-analyst role may prioritize Python-based cohort or funnel analysis instead.
Beginner Data Analyst Projects
Beginner projects should still follow the full analytical chain the difference from intermediate work is data complexity and ambiguity, not the presence or absence of business reasoning. These beginner data analyst projects are a starting point, not a ceiling.
Sales Performance Analysis
- Business Problem: Which products, regions, or time periods are underperforming, and why?
- Dataset: Retail or e-commerce transaction data with dates, product categories, regions, and revenue.
- Skills Demonstrated: Data cleaning, aggregation, trend analysis, basic visualization.
- Tools: SQL, Excel, Power BI.
- Analysis: Revenue trends over time, top/bottom performers, seasonality patterns.
- Deliverables: A short written summary, a dashboard, and documented SQL queries.
- Hiring Signal: Ability to translate raw transactional data into a business narrative.
- Potential Interview Questions: How did you define “underperforming”? How did you handle returns or refunds in the revenue calculation?
- Difficulty: Beginner
Customer Segmentation
- Business Problem: Are there distinct customer groups the business should target differently?
- Dataset: Customer transaction or demographic data.
- Skills Demonstrated: Grouping logic, basic segmentation (e.g., RFM recency, frequency, monetary value), summarization.
- Tools: SQL, Excel, Python (pandas).
- Analysis: Segment customers by purchase behavior; describe each segment’s characteristics.
- Deliverables: A segmentation table or chart plus a short interpretation of what each segment means for the business.
- Hiring Signal: Ability to convert raw behavior data into decision-usable groups.
- Potential Interview Questions: Why did you choose these segmentation variables? How would marketing act differently for each segment?
- Difficulty: Beginner
Marketing Campaign Analysis
- Business Problem: Which campaigns produced the best return relative to spend?
- Dataset: Campaign-level spend, clicks, conversions data.
- Skills Demonstrated: Rate calculations (CTR, conversion rate), comparative analysis.
- Tools: Excel, SQL, Power BI/Tableau.
- Analysis: Compare campaigns on conversion rate and cost per acquisition, not just raw volume.
- Deliverables: A comparison dashboard and a short recommendation memo.
- Hiring Signal: Understanding that raw totals can be misleading without rate-based metrics.
- Potential Interview Questions: Why compare conversion rate instead of total conversions? What would you need to calculate true ROI?
- Difficulty: Beginner
Employee Attrition Analysis
- Business Problem: What factors are associated with employees leaving?
- Dataset: HR dataset with tenure, department, satisfaction scores, and attrition flags.
- Skills Demonstrated: Categorical analysis, cross-tabulation, cautious correlation interpretation.
- Tools: SQL, Excel, Python.
- Analysis: Compare attrition rates across departments, tenure bands, and other variables.
- Deliverables: A findings summary that explicitly avoids overstating causation.
- Hiring Signal: Statistical caution recognizing correlation is not causation.
- Potential Interview Questions: Could any of these factors be confounded with something else? What data would you need to test causation?
- Difficulty: Beginner to Intermediate
E-Commerce Analysis
- Business Problem: Where in the customer journey are sales being lost?
- Dataset: Order-level and browsing/session data.
- Skills Demonstrated: Funnel thinking, basic conversion-rate analysis.
- Tools: SQL, Excel, Power BI.
- Analysis: Cart abandonment rates, category-level conversion differences.
- Deliverables: A funnel chart with a short explanation of the biggest drop-off point.
- Hiring Signal: Ability to think in terms of a process, not just a snapshot of totals.
- Potential Interview Questions: How did you define a “session”? What are alternative explanations for the drop-off you found?
- Difficulty: Beginner to Intermediate
Financial Performance Analysis
- Business Problem: What is driving changes in profitability?
- Dataset: Revenue, cost, and expense data by category or time period.
- Skills Demonstrated: Margin calculations, variance analysis.
- Tools: Excel, SQL.
- Analysis: Break down profitability changes into revenue and cost components.
- Deliverables: A variance analysis table and short narrative.
- Hiring Signal: Comfort working with financial terminology and structure.
- Potential Interview Questions: How did you separate one-time versus recurring cost changes? What assumptions did you make about missing cost data?
- Difficulty: Beginner to Intermediate
Intermediate Data Analyst Projects
Intermediate work is defined by working across multiple tables, tracking behavior over time, or reasoning through ambiguity not by simply adding more charts to a beginner project.
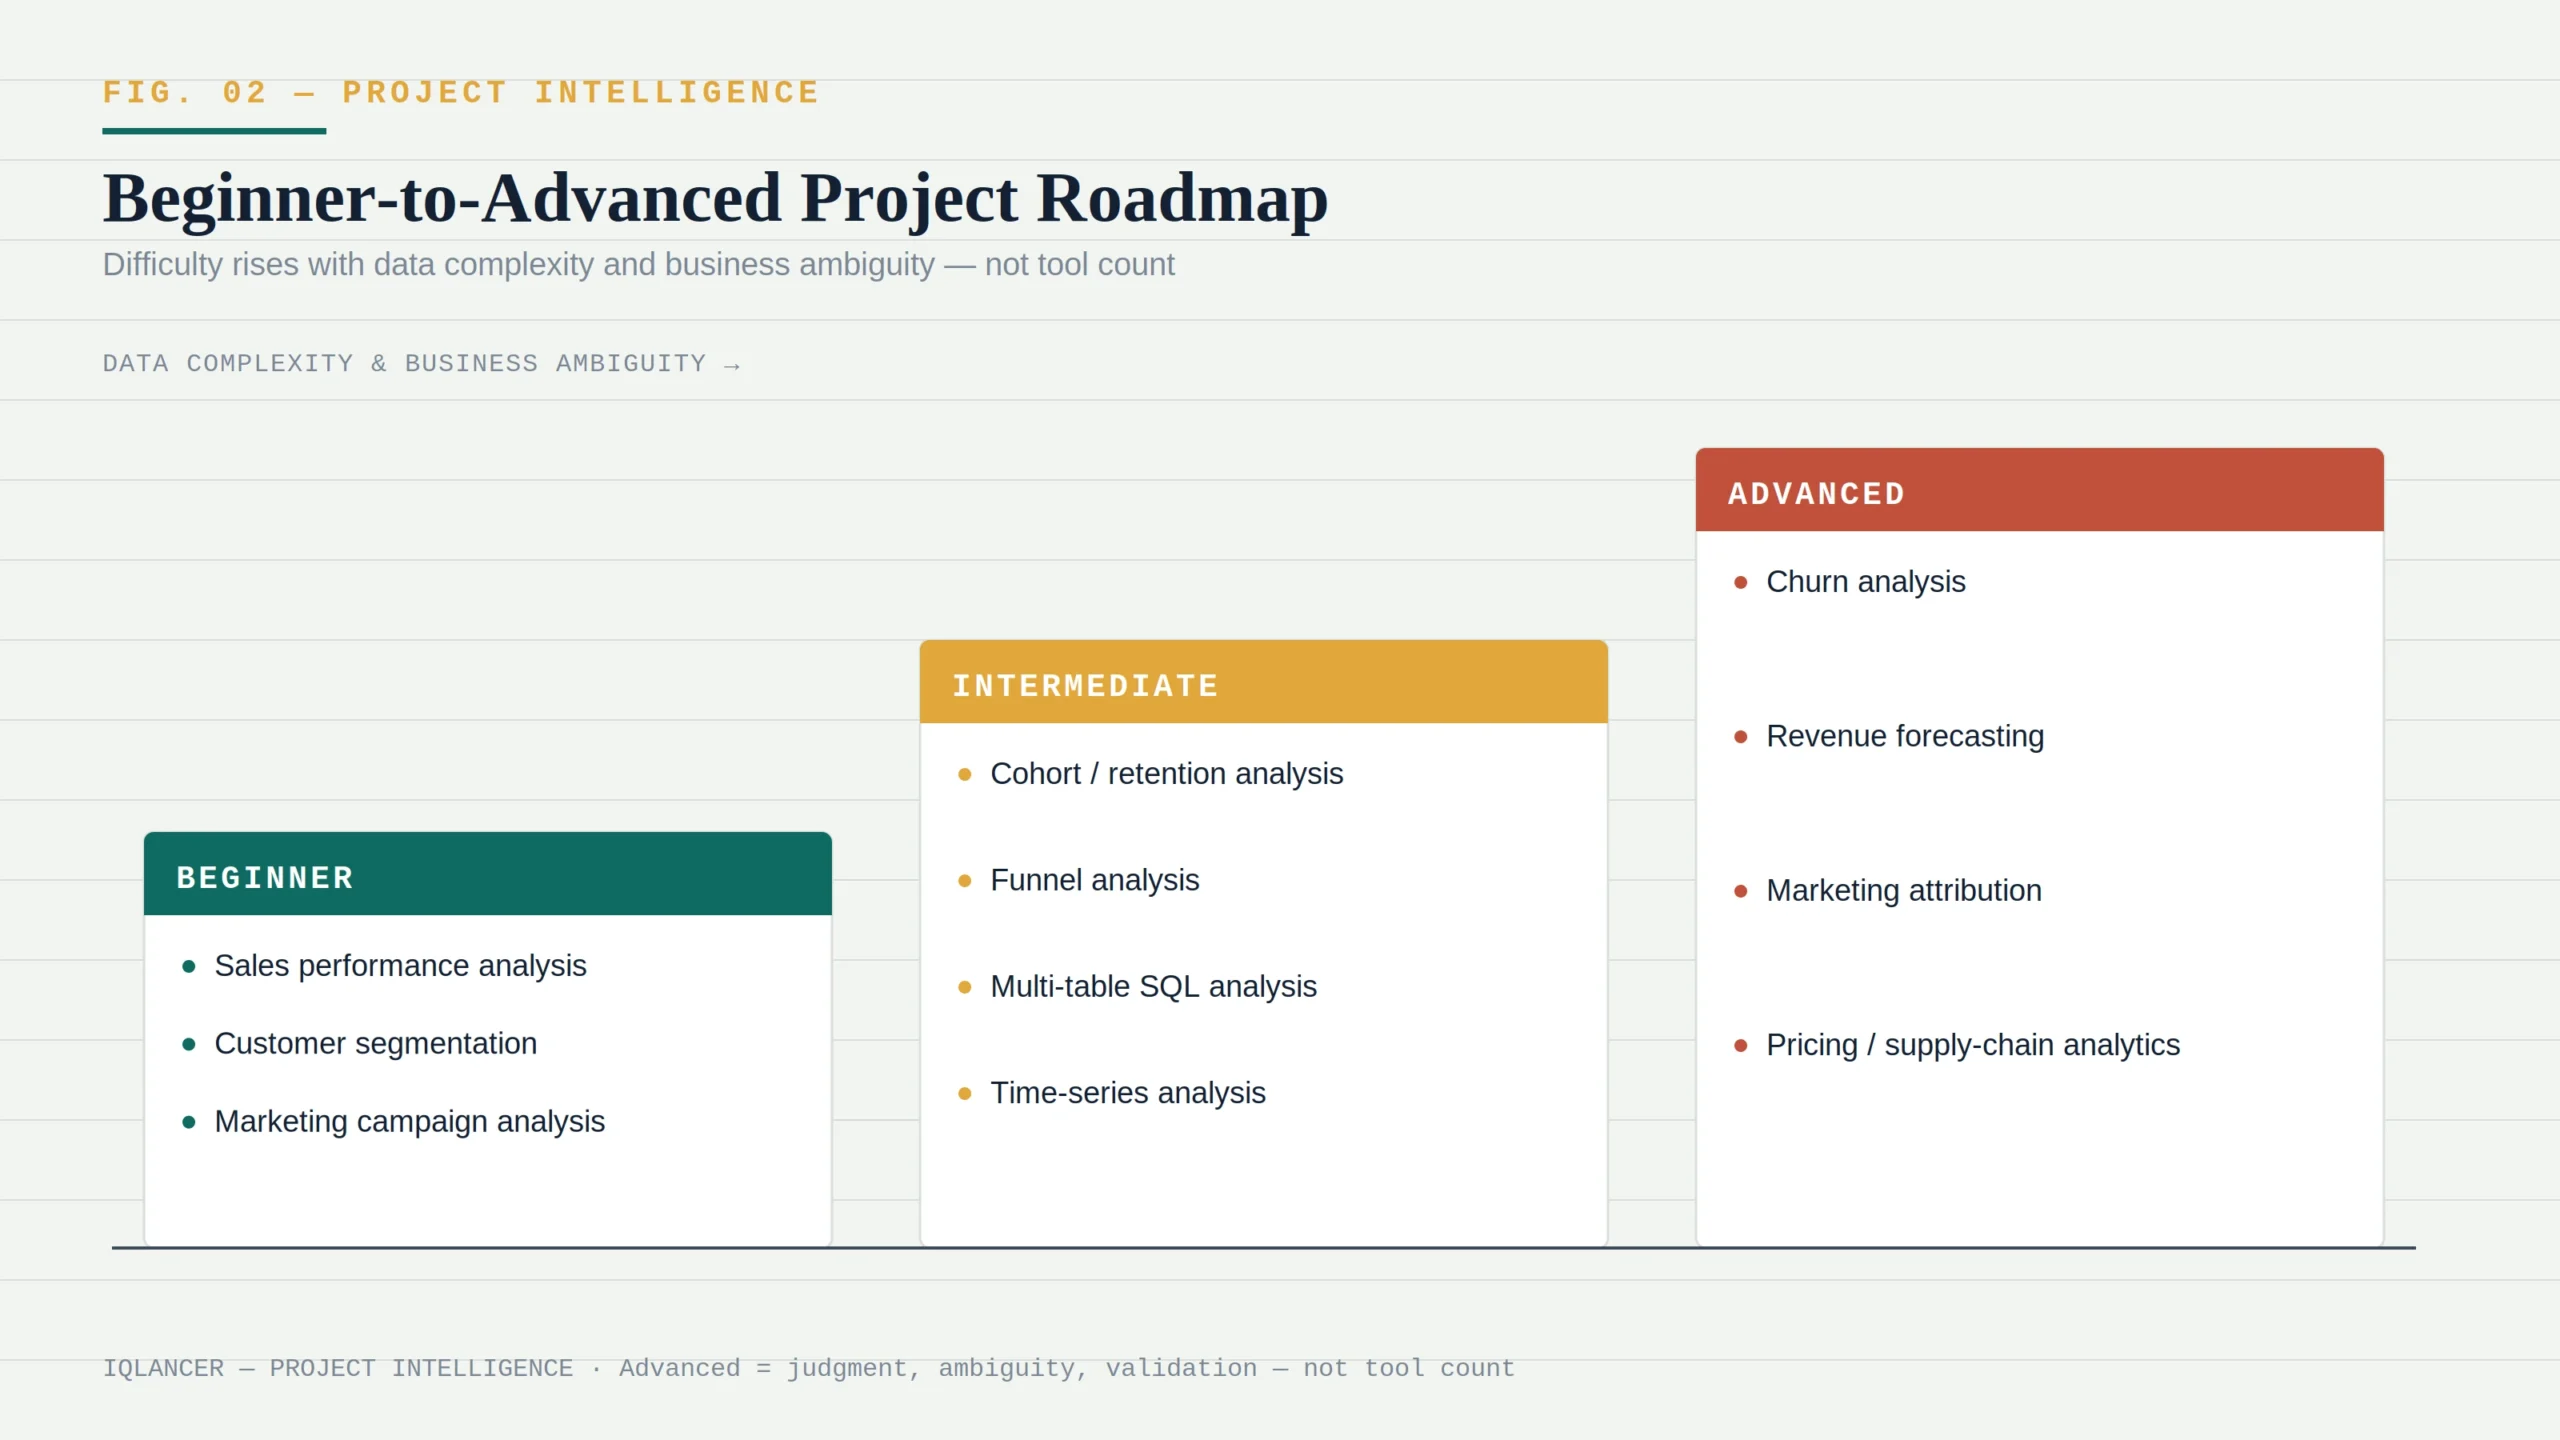
Customer Retention / Cohort Analysis : Groups customers by signup period and tracks their behavior over time, revealing whether retention is improving or declining across cohorts, which is a meaningfully harder analytical task than a single-period snapshot.
Funnel Analysis : Traces users through a multi-step process (signup → activation → purchase, for example) and quantifies drop-off at each stage, usually requiring multi-table SQL joins across events, sessions, and users.
Multi-Table SQL Analysis : Deliberately works with a normalized schema (three or more related tables) instead of a single flat file, demonstrating join logic, subqueries, and window functions that flat-file beginner projects rarely require.
Time-Series Analysis : Examines trends, seasonality, and anomalies across a longer time span, requiring decisions about how to handle missing periods and how to distinguish real trend shifts from noise.
Operational Analytics : Analyzes throughput, delays, or capacity in a process (e.g., delivery times, support ticket resolution), connecting operational data to efficiency-focused business recommendations.
These projects demonstrate more than dashboard creation because they force decisions under ambiguity: which cohort definition is meaningful, how to define a “conversion” event consistently across a funnel, or how to separate seasonal effects from an actual trend. Apply the full Project Intelligence Framework from Section to each of these the stages don’t change, only the complexity of the data and the reasoning within them.
Advanced Data Analyst Projects
A project earns the “advanced” label from the depth of reasoning it requires, not from the number of technologies it lists; this distinction matters because candidates sometimes conflate tool-stacking with analytical sophistication.
Categories worth exploring at this level include churn analysis, product analytics, revenue forecasting, pricing analysis, marketing attribution, operations analytics, and supply-chain analytics. What actually makes any of these “advanced” is a combination of factors: multiple, non-trivial datasets that must be joined or reconciled; statistical reasoning beyond simple averages (e.g., segment-level churn rates, basic regression, confidence intervals); genuine business ambiguity where more than one reasonable interpretation exists; and a validation step where the analyst checks their own result against a second method or a sanity check before presenting it.
A churn analysis project, for example, becomes advanced not because it uses Python instead of Excel, but because the analyst has to decide how to define “churned,” account for customers who paused rather than left, and validate that the churn drivers identified aren’t simply proxies for tenure. That layer of judgment not the tool stack is what an interviewer is actually probing for at this level.
Projects by Business Problem
Organizing project ideas around a real business question, rather than a random dataset, makes the resulting analysis more coherent and easier to defend; this reframing is one of the most practical shifts a candidate can make.
| Business Function | Core Question |
|---|---|
| Revenue | What is driving revenue up or down? |
| Customer | Why are customers leaving, and who is most at risk? |
| Marketing | Which campaigns or channels perform better, and why? |
| Product | Where do users drop off, and what happens right before they do? |
| Operations | Where are inefficiencies occurring in the process? |
| Finance | What is affecting profitability, and is it structural or temporary? |
Starting from a business question forces a candidate to choose a dataset that fits the question, rather than starting with whatever dataset is available and forcing a question onto it after the fact. The former produces coherent, defensible projects; the latter tends to produce projects that read as reverse-engineered.
Projects by Target Data Analyst Role
Project selection should shift depending on the specific analyst role being targeted; this section exists so candidates stop building generic, one-size-fits-all portfolios and start building evidence aimed at a role.
- Marketing Analyst: Campaign analysis, conversion funnels, customer segmentation, channel-level marketing performance.
- Product Analyst: Funnel analysis, retention and cohort analysis, feature adoption tracking.
- Financial Analyst: Revenue analysis, profitability breakdowns, forecasting, budget variance analysis.
- Operations Analyst: Process efficiency, delivery performance, capacity planning, operational KPI tracking.
- BI Analyst: Dashboard design, structured reporting, SQL depth, data modeling.
These categories are not universal across every company. A “Marketing Analyst” at one company may do heavy SQL work, while at another the role leans almost entirely on a BI tool. Use these as a starting orientation, then adjust based on the actual job descriptions for roles being targeted (see Section for how to do that research systematically).
Project-to-Skill Mapping
Mapping each project type against the skills it exercises helps identify portfolio gaps before an interviewer does; this table is a planning tool, not a claim about what any specific employer requires.
| Project Type | SQL | Excel | Python | Statistics | Data Cleaning | Power BI/Tableau | Business Analysis | Communication |
|---|---|---|---|---|---|---|---|---|
| Sales Performance | ✔ | ✔ | – | – | ✔ | ✔ | ✔ | ✔ |
| Customer Segmentation | ✔ | ✔ | ✔ | ✔ | ✔ | – | ✔ | ✔ |
| Marketing Campaign | ✔ | ✔ | – | – | ✔ | ✔ | ✔ | ✔ |
| Cohort/Retention | ✔ | – | ✔ | ✔ | ✔ | – | ✔ | ✔ |
| Funnel Analysis | ✔ | – | ✔ | ✔ | ✔ | ✔ | ✔ | ✔ |
| Churn Analysis | ✔ | – | ✔ | ✔ | ✔ | – | ✔ | ✔ |
| Financial Performance | ✔ | ✔ | – | ✔ | ✔ | – | ✔ | ✔ |
If a candidate’s entire portfolio maps almost identically across this table (for example, everything is SQL + Power BI with no Python or statistics anywhere), that’s a signal the portfolio may be less differentiated than it appears.
How to Choose a Dataset
Choosing a dataset well is a distinct skill from analyzing it, and it’s rarely taught explicitly; this section breaks down what actually makes one dataset a better foundation than another.
Worth evaluating before committing to a dataset:
- Business relevance can a real question plausibly be asked of this data?
- Data quality does it have enough imperfection (missing values, inconsistent formats) to require real cleaning decisions?
- Complexity does it have enough variables and relationships to support more than a single chart?
- Number of variables too few limits analytical depth; too many can overwhelm a first project.
- Missing values a dataset with zero missing values is often too polished to demonstrate cleaning skills.
- Analytical potential can more than one type of question be asked of it?
- Realism does it resemble something an actual company would have?
- Licensing is redistribution and portfolio use actually permitted?
- Accessibility is it publicly downloadable without paywalls or approval processes?
- Documentation does it come with a data dictionary or field descriptions?
The critical mental shift here: a dataset is not a project. A dataset becomes a project only when a candidate defines a specific business question and builds an analytical process around answering it. The same retail transactions file can become five different projects depending on the question asked of it.
Where to Find Datasets
Dataset quality varies enormously by source, and licensing terms matter more than most beginners realize; this section points toward sources that are both legitimate and currently accessible.
- Kaggle : A large, actively maintained catalog of user- and organization-submitted datasets across nearly every domain; check each dataset’s individual license before reuse.
- Data.gov : The U.S. government’s open data portal, useful for public-sector, health, and economic analysis.
- World Bank Open Data / DataBank : global development, economic, and demographic indicators, well-suited to macro-level or cross-country analysis, with an interactive DataBank tool for building custom extracts.
- World Bank Data Catalog : A more granular catalog of World Bank datasets including project and operations data.
- UCI Machine Learning Repository : A long-standing academic repository of structured datasets, strong for benchmarking and classic analytical exercises.
- Google Dataset Search : A search engine across datasets hosted elsewhere, useful for discovering niche or industry-specific data.
- FiveThirtyEight’s data repository : journalism-oriented datasets that already come with a clear narrative angle.
- Public APIs (e.g., government statistical agencies, some company developer APIs) useful for showing data-collection skills, not just analysis of a static file.
Licensing deserves real attention rather than a footnote: some datasets are released for personal or educational use only, and reusing them in a public portfolio without checking the license can create avoidable problems. Always read the specific license attached to a dataset rather than assuming “public” means “unrestricted.”
How to Turn a Dataset Into a Real Business Project
This is where most candidates lose the thread they describe the data instead of describing the decision the data is meant to support. The fix is a simple reframing exercise.
Weak framing: “I analyzed a retail dataset.”
Better framing: “A retail business wants to understand why repeat purchases have declined over the past two quarters.”
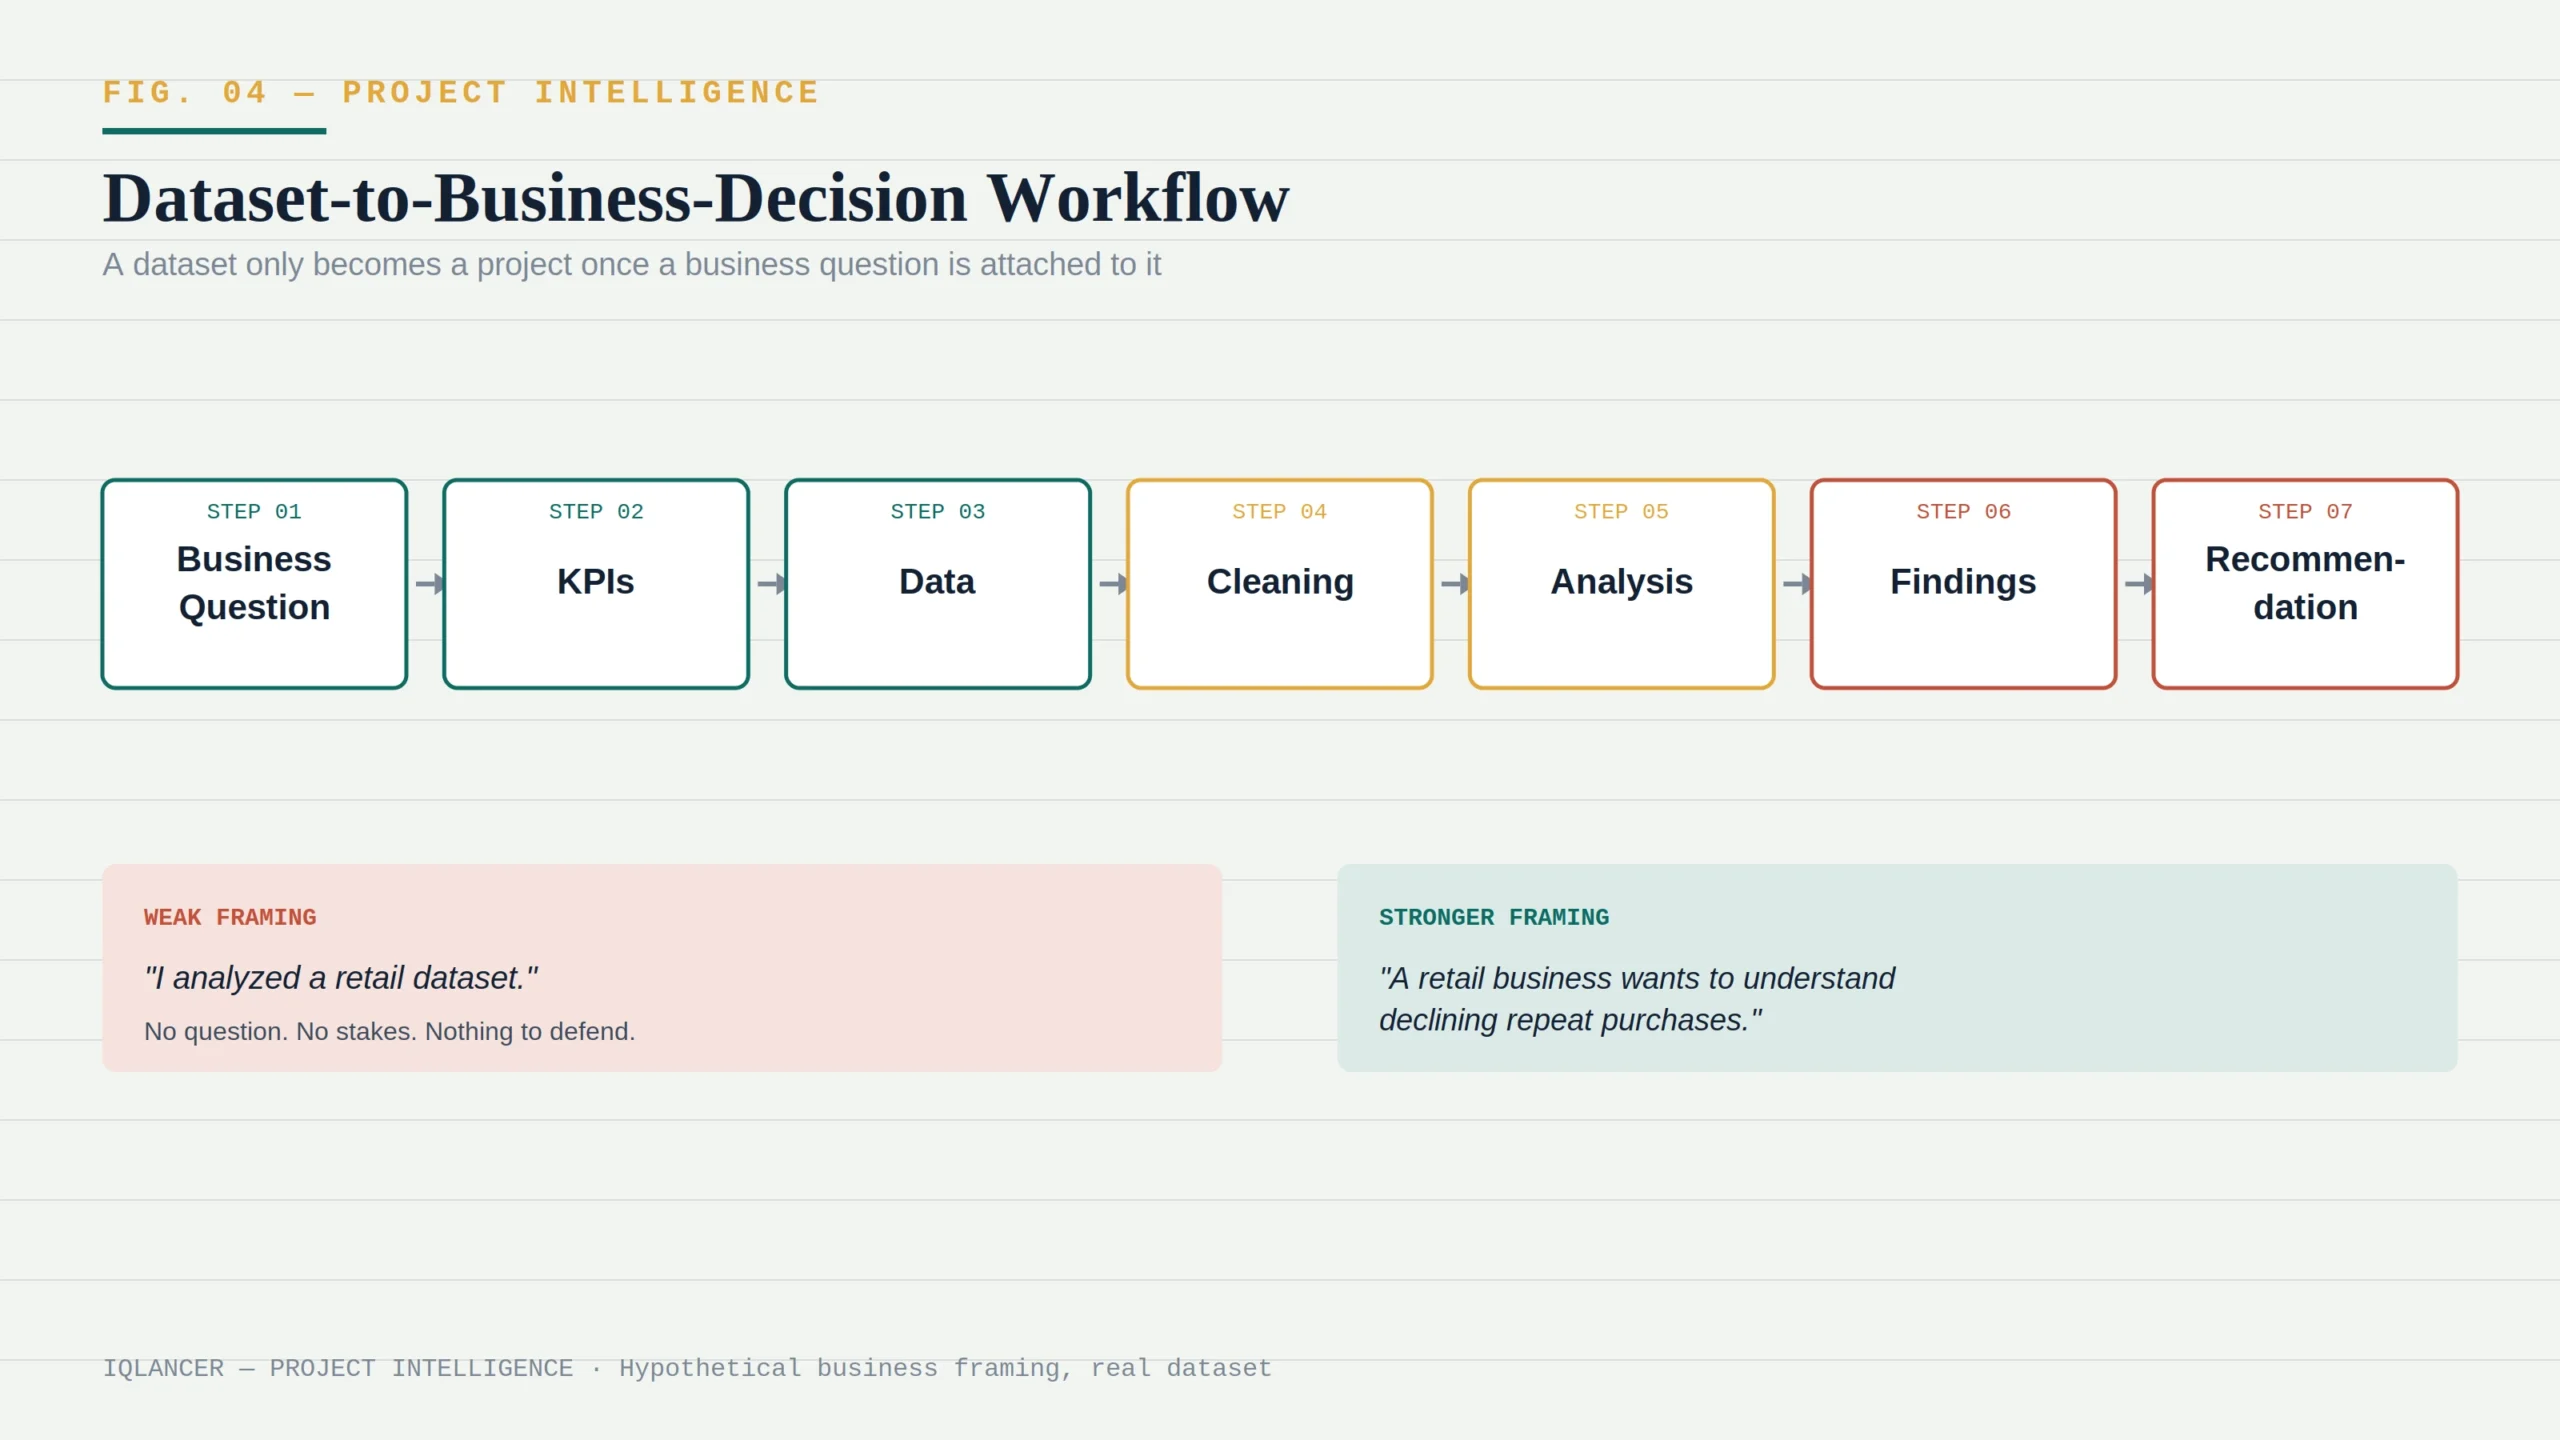
From there, the chain should run:
Business Question (“Why are repeat purchases declining?”) → KPIs (repeat purchase rate, average days between orders, customer lifetime value by cohort) → Data (order history, customer IDs, timestamps) → Cleaning (deduplicating customer records, standardizing date formats, handling refunded orders) → Analysis (cohort comparison, segment-level repeat-rate calculation) → Findings (a specific, falsifiable statement about which segment’s repeat rate dropped and when) → Recommendation (a specific action tied to that finding, such as targeting a lapsed segment with a win-back campaign).
Note that this business scenario is hypothetical clearly label any invented business context as a framing device rather than implying it reflects a real company’s confirmed situation. The dataset itself should be real and sourced; the business narrative wrapped around it can be a reasonable, clearly labeled hypothetical used to give the analysis purpose.
What Every Strong Data Analyst Project Should Contain
A complete project has a predictable anatomy listing it explicitly here means every project built afterward can be checked against the same checklist instead of guessed at.
- A clearly stated business problem and objective
- The dataset source, with a link and license note
- A data dictionary describing each field
- A documented cleaning process (what was found, what was done about it, and why)
- An explanation of the analysis methodology
- The actual SQL queries used, not just their output
- Python notebooks where applicable, with markdown explaining each step
- A dashboard or set of visualizations
- Specific, written findings
- Business recommendations tied to those findings
- A limitations section stated honestly
- Suggested next steps
- Clear documentation (a README at minimum) that lets a stranger follow the entire chain
What should be publicly visible, ideally, is everything above except sensitive or private data. A project where only the final dashboard is visible with no queries, no cleaning notes, and no written findings is much weaker evidence than one where the full process is inspectable.
Data Analyst Portfolio Projects
Naturally, the phrase “data analyst portfolio projects” implies a collection, and collections need a strategy of their own this section is about how the pieces fit together, not any single project in isolation.
A strong portfolio isn’t built by adding more of the same type of project; it’s built by covering distinct capabilities. Consider these dimensions when selecting a set of projects:
- Project variety : Different analytical techniques (segmentation, funnel analysis, forecasting), not five variations on a sales dashboard.
- Skill coverage : Collectively touching SQL, a spreadsheet tool, a BI tool, and ideally some Python or statistical reasoning.
- Business-domain diversity : Spanning more than one industry or function (e.g., retail and HR, not five retail projects).
- Technical depth : At least one project that goes beyond descriptive statistics into segmentation, cohort analysis, or basic forecasting.
- Storytelling : Each project communicated as a narrative with a beginning (problem), middle (analysis), and end (recommendation).
- Documentation : Consistent quality across all projects, not one polished flagship surrounded by unfinished ones.
Five similar dashboards covering five different but structurally identical datasets are weaker evidence than three projects that each demonstrate a genuinely different analytical capability. Reviewers scanning a portfolio are looking for range.
Projects for Data Analyst Resume
Deciding what belongs on a resume is a separate skill from building the project itself; this section focuses specifically on how project work should be translated into resume language.
- Weak: “Created a Power BI dashboard.”
- Better structure: Action + Business Context + Tool + Analysis + Finding/Decision (where genuinely supported by the work).
- For example: “Analyzed two years of retail transaction data using SQL and Power BI to identify declining repeat-purchase segments, then proposed a targeted retention approach based on cohort-level findings.”
Notice what’s absent from that example: no invented percentage, no fabricated revenue impact. If a project genuinely produced a measurable before/after result (for instance, in a real work setting where the recommendation was actually implemented), that number belongs on the resume.
If the project is a personal portfolio piece without a real business outcome to measure, the resume bullet should describe the analysis and recommendation, not a fictional business impact. Inventing a metric to make a personal project look like a workplace result is a credibility risk the moment an interviewer asks a follow-up question.
How to Write Data Analyst Project Resume Bullets
Below are templates structures to be filled with real project evidence, not filled with invented outcomes.
- “Analyzed [business problem] using [tool], identifying [finding], and translated the analysis into [recommendation/decision].”
- “Built a [tool] dashboard tracking [KPI] across [dimension], surfacing [specific finding] that informed [type of recommendation].”
- “Queried and cleaned [data volume/description] using SQL, resolving [specific data quality issue], to support analysis of [business question].”
- “Conducted [type of analysis, e.g., cohort/funnel/segmentation] on [dataset], identifying [specific pattern] and recommending [action].”
Every bracket should be replaced with something the candidate can defend in detail if asked a follow-up question. If a bracket can’t be filled with something true and specific, that’s a sign the underlying project isn’t finished yet not a reason to write around the gap.
GitHub Projects for Data Analysts
A GitHub repository is often the first thing a hiring manager actually opens, which makes its structure and content as important as the analysis inside it; this section covers what belongs in a strong repository for GitHub projects for data analysts.
A repository worth opening should include: a clear README explaining the business problem in the first few lines (not buried after a wall of setup instructions); the dataset source and license; a data dictionary; the SQL used; any Python notebooks with markdown commentary explaining each step, not just code; the cleaning scripts or a written description of the cleaning process; visualizations or screenshots of the dashboard; a written findings and recommendations section; a stated limitations section; and a link to a live dashboard where applicable (e.g., Tableau Public or a Power BI published report).
A repository that contains only a Jupyter notebook with no README and no narrative forces a reviewer to reconstruct the story themselves most won’t take the time.
GitHub Repository Structure
A consistent folder structure makes a repository easier to review quickly, though the exact layout matters far less than clarity and reproducibility. One reasonable example.
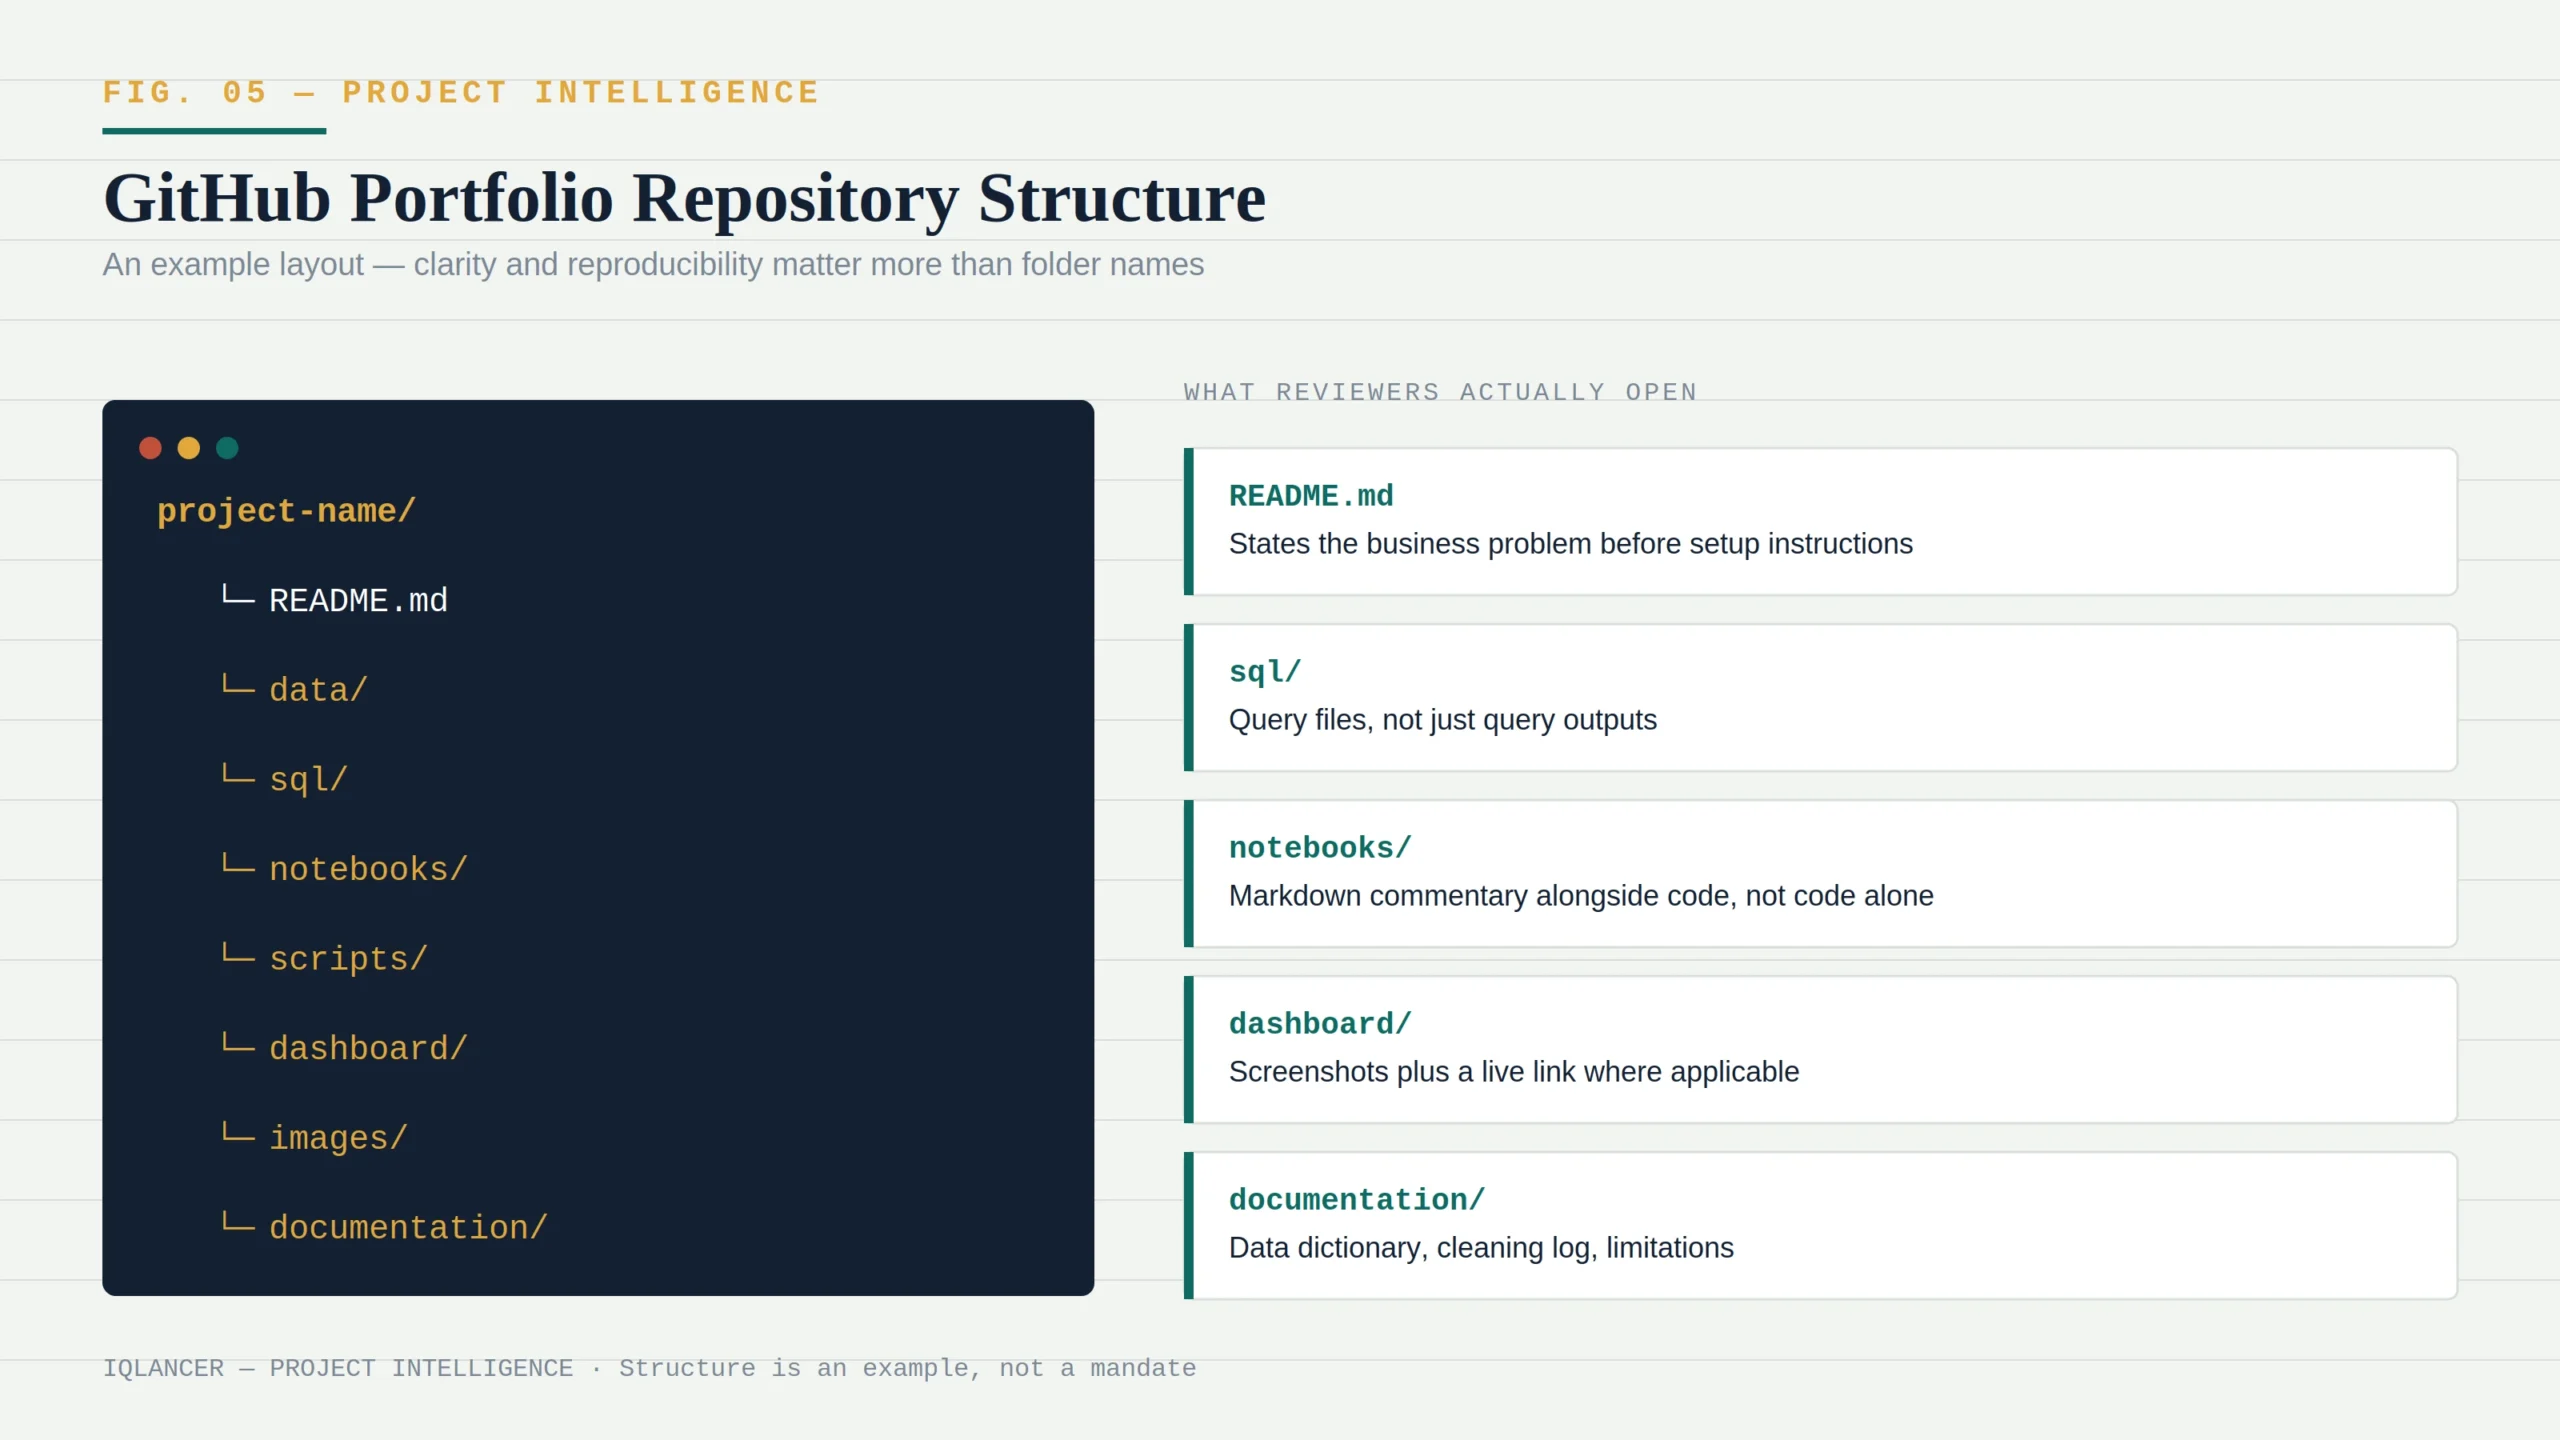
This is an example, not a mandatory template. A reviewer skimming a repository cares far more about whether the README explains the project clearly and whether the work is reproducible than about which specific folder names were used.
How to Evaluate Your Own Project
Before adding a project to a portfolio, it helps to run it through a structured self-check rather than relying on a gut feeling that “it looks finished.”
| Dimension | Question |
|---|---|
| Business Problem | Is the question meaningful, and would a real stakeholder actually ask it? |
| Data Quality | Did I actually inspect and clean the data, or use it as-is? |
| Technical Depth | Does this demonstrate the tools relevant to my target role? |
| Analytical Depth | Did I go beyond basic charts into real reasoning? |
| Business Reasoning | Are my findings connected to an actual decision? |
| Documentation | Could a stranger understand this without asking me questions? |
| Presentation | Can I explain this clearly out loud, without notes? |
| Interview Readiness | Can I defend every methodological choice I made? |
A project that scores poorly on “Interview Readiness” specifically is often salvageable usually it just needs the candidate to re-examine their own decisions and write down the reasoning they already used but never documented.
Project Quality Scoring
A simple self-assessment scoring exercise can help prioritize which projects need more work before publishing this is an IQLancer self-assessment framework, not an industry-standard hiring score, and no employer will actually see or use this specific rubric.
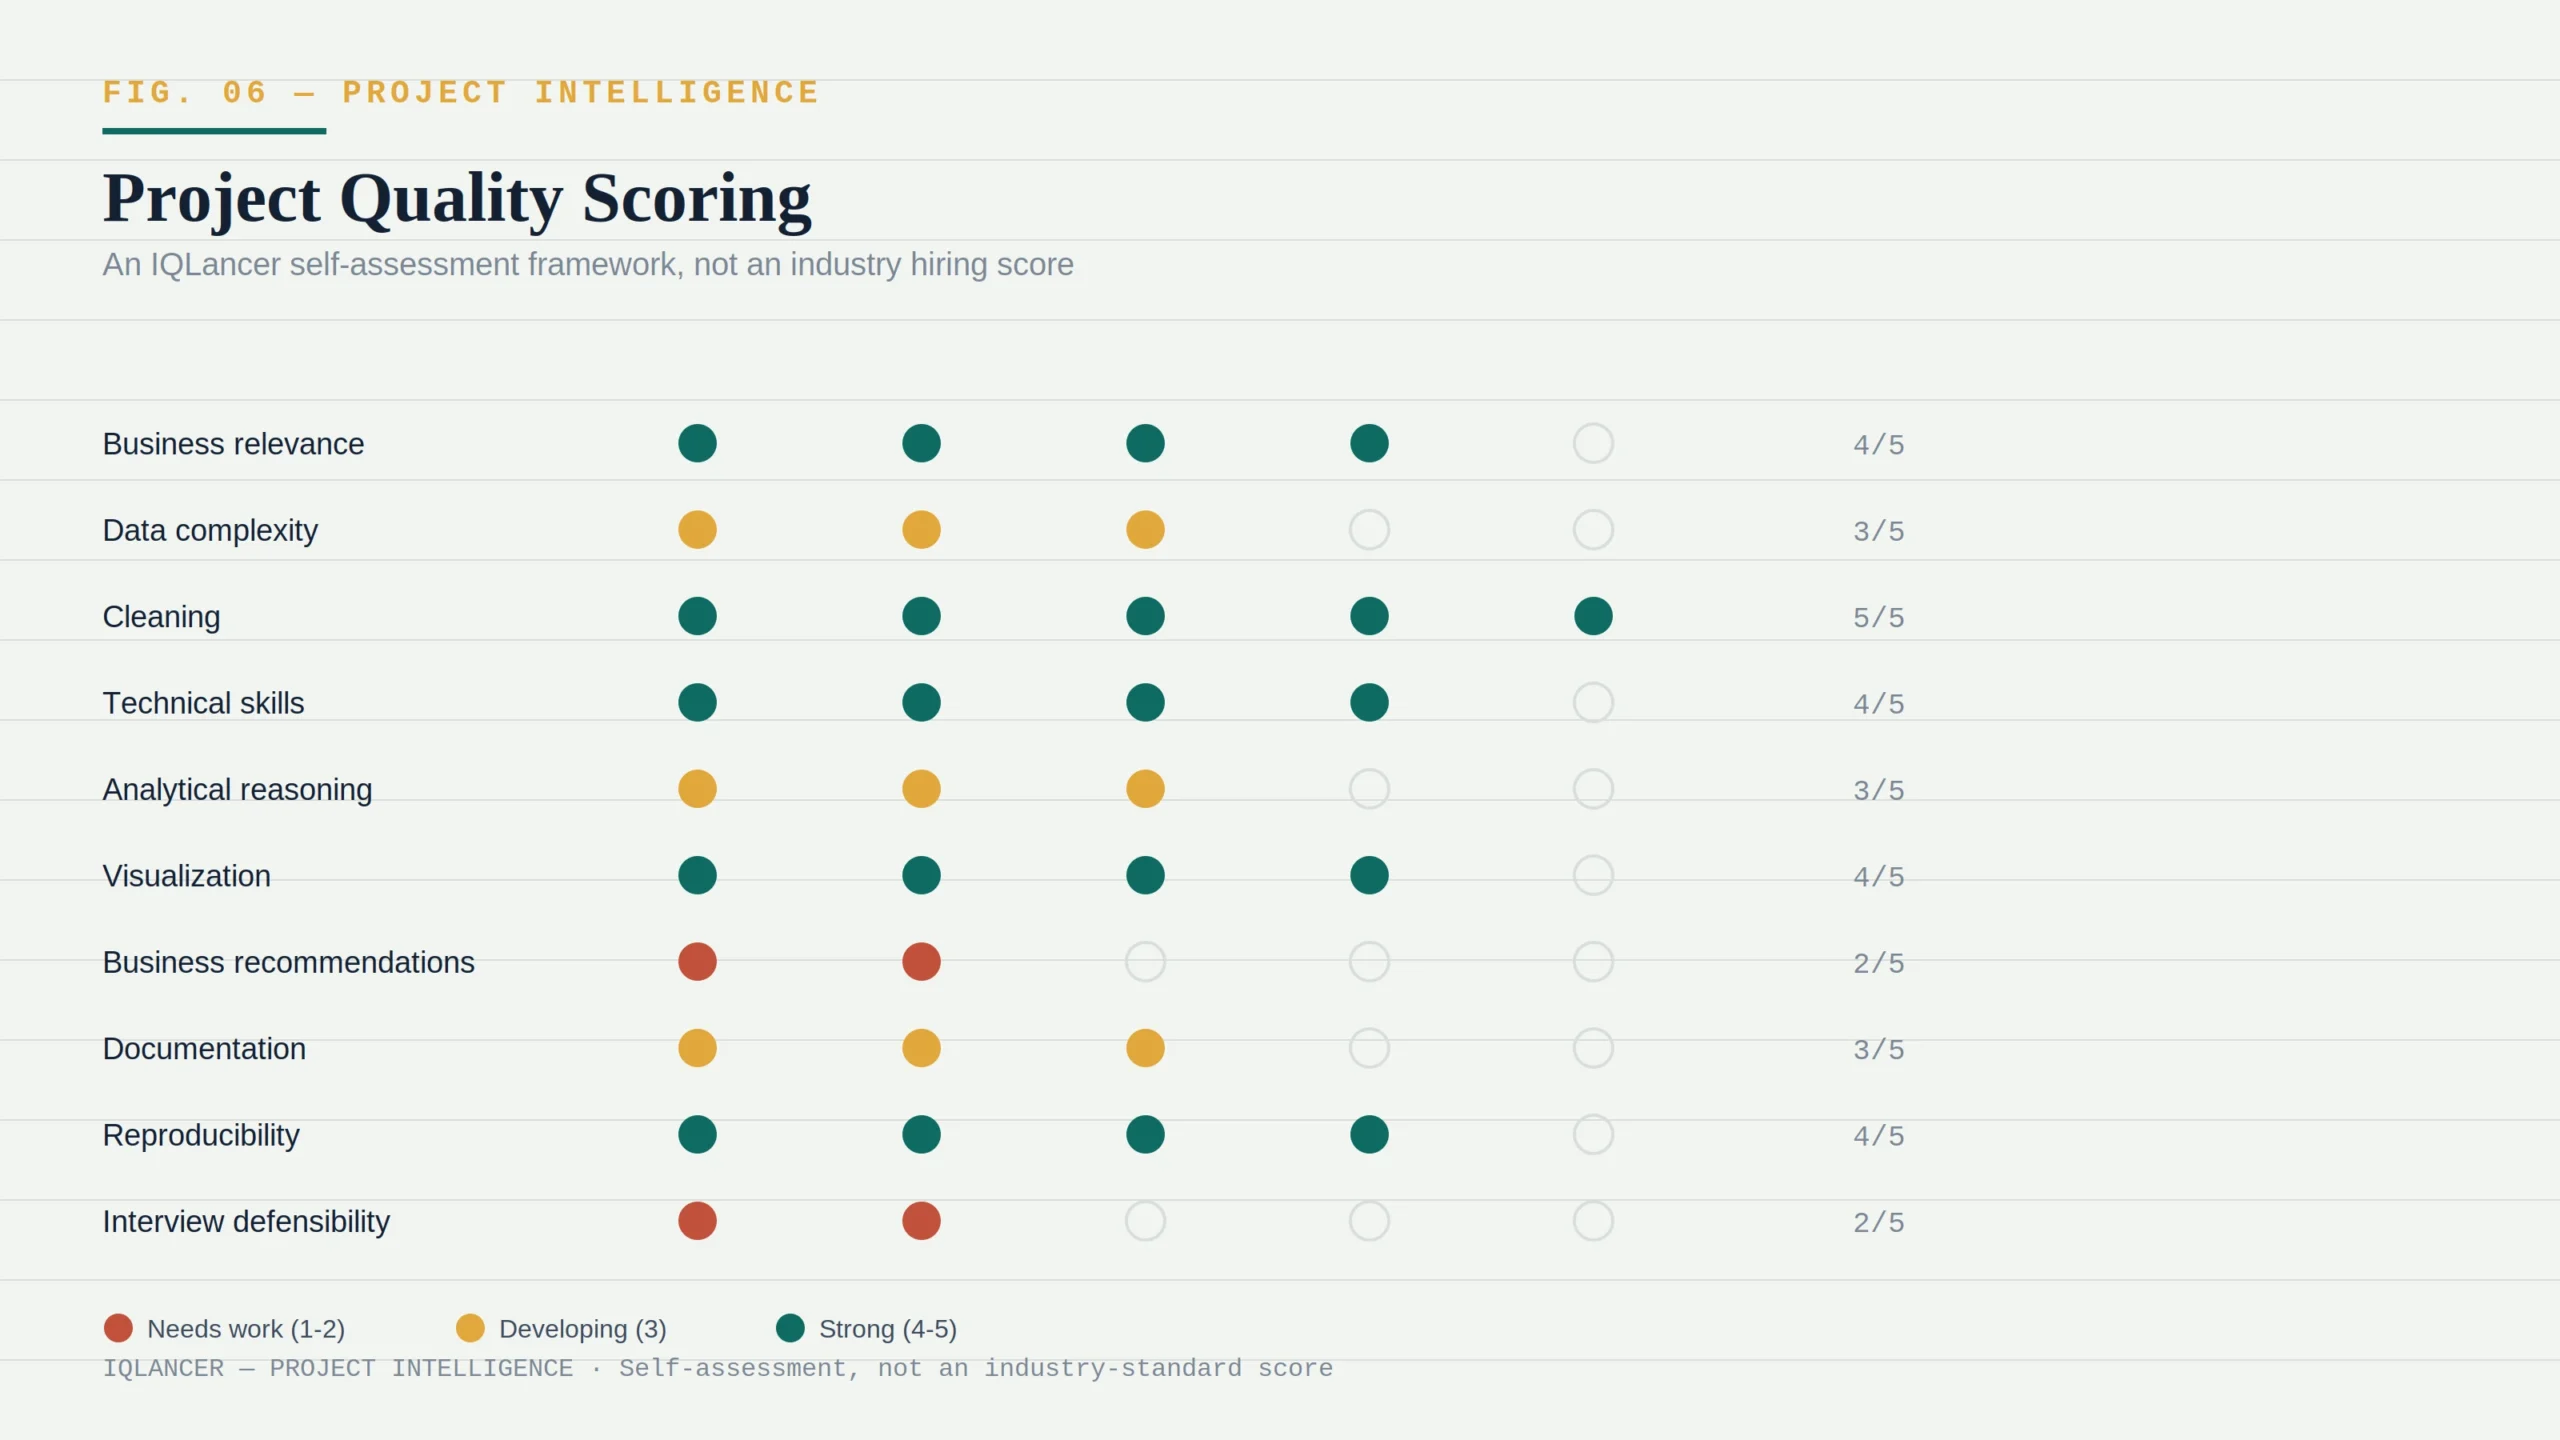
Score each project from 1–5 across: business relevance, data complexity, cleaning quality, technical skill demonstrated, analytical reasoning, visualization quality, strength of business recommendations, documentation completeness, reproducibility, and interview defensibility.
A project scoring consistently low across cleaning, documentation, and defensibility regardless of how good the chart looks is a project that needs revision before it goes into a portfolio, not one that needs a nicer color palette.
Project Portfolio Red Flags
Certain patterns are common enough in weak portfolios that they’re worth naming directly, along with how an employer is likely to interpret each one and how to address it.
| Red Flag | How an Employer May Interpret It | How to Fix It |
|---|---|---|
| Copied Kaggle notebook | No independent thinking demonstrated | Rebuild the analysis with a different question or method |
| Tutorial clone | Candidate followed instructions, didn’t reason independently | Add original business framing and different analytical choices |
| Generic dashboard, no business question | Tool operator, not analyst | Add a stated problem, findings, and recommendation |
| No SQL evidence | Cannot independently query data | Add a SQL component even to a BI-heavy project |
| No cleaning explanation | Cannot handle real-world messy data | Document what was found and how it was handled |
| No README | Reviewer has to guess the story | Write a clear README as the first thing in the repo |
| No recommendations | Descriptive only, not decision-oriented | Add a specific “so what” section |
| No limitations stated | May overstate confidence in findings | Add an honest limitations section |
| Too many similar projects | Portfolio lacks range | Replace duplicates with a different analytical technique |
| Tools listed without evidence | Resume claim unsupported by visible work | Ensure every listed tool appears in at least one visible project |
| Candidate can’t explain their own work | Suggests the work wasn’t truly their own | Rehearse explaining methodology and decisions out loud |
Questions Recruiters or Hiring Managers May Ask
Every major decision in a project is a potential interview question. Common ones include:
- Why did you choose this dataset?
- What business problem were you actually solving?
- How did you clean the data, and what did you find?
- What assumptions did you make where the data was ambiguous?
- Why this SQL approach instead of an alternative?
- Why this visualization instead of another chart type?
- What was your single most important finding?
- How did you validate that result?
- What limitations does this analysis have?
- What would you do differently with more data or more time?
- What recommendation would you make, and to whom?
- What would you do if a stakeholder disagreed with your conclusion?
- What would you change if you repeated this project today?
The underlying principle: a candidate should be able to defend every major decision in a project, not just describe the output. An interviewer probing these questions isn’t testing memorization they’re testing whether the reasoning behind the project actually belongs to the candidate.
Why Good Projects Still Don’t Get Interviews
Even technically solid projects sometimes fail to generate interest, and it’s worth being honest about the likely reasons rather than assuming the project itself is always the problem.
Common contributing factors include: the project doesn’t match the target role (a BI-heavy portfolio applied to a Python-heavy product analyst role, for instance); the work reads as tutorial-style rather than original; SQL usage is shallow or absent; the analytical reasoning stops at description without a recommendation; documentation is missing or thin; GitHub presentation buries the story instead of leading with it; the resume doesn’t actually reference or connect to the visible project evidence; the portfolio contains too many similar, low-differentiation projects; or the candidate, when asked, cannot explain the project’s own reasoning.
These are presented as plausible, commonly cited contributing factors rather than a proven universal cause-and-effect list hiring decisions involve many variables outside a candidate’s portfolio, including market conditions, role fit, and timing, and no credible source can claim a fixed hierarchy of causes without company-specific data.
Match Projects to Job Descriptions
This is the IQLancer core insight for this entire topic: projects are only as valuable as their fit to the target role, and that fit has to be engineered deliberately rather than hoped for.
The workflow: Target Job → Job Description → Recurring Skills → Skill Gaps → Project Selection → Project Evidence → Portfolio → Resume → Interview Defense.
Start with a specific target job posting or a small set of similar postings. Extract the recurring technical and business skills mentioned. Compare that list against the current portfolio to identify gaps skills mentioned repeatedly in the job descriptions but absent from any visible project. Select or build a project specifically to close that gap. Turn that project into visible evidence (GitHub, dashboard link, documented process). Reference it explicitly on the resume in language that echoes the job description’s own terms. Prepare to defend it using the interview-question list from Questions Recruiters or Hiring Managers May Ask Section.
This workflow turns portfolio-building from a generic “build some projects” activity into a targeted response to specific hiring signals which is the difference between a portfolio built for interviews in general and one built for a specific type of role.
How to Analyze 20–30 Data Analyst Job Postings
This is a research method any candidate can run themselves, and it’s more reliable than relying on generic “top skills” lists, since it reflects the candidate’s actual target market.
- Collect 20–30 postings for the specific role and seniority level being targeted.
- Record the company, exact job title, and required experience level for each.
- Extract recurring technical skills (SQL, Excel, Python, specific BI tools).
- Extract recurring business skills (KPI ownership, stakeholder communication, forecasting).
- Note which specific tools appear most often across the set.
- Identify recurring project-type responsibilities (e.g., “campaign analysis,” “cohort reporting”).
- Separate requirements into Must Have, Preferred, and Nice to Have based on the language used (“required” vs. “preferred” vs. “a plus”).
- Compare this list against the candidate’s current portfolio to identify gaps.
- Choose or adjust projects specifically to close the most impactful gaps.
The result of this exercise will vary meaningfully by local market, target industry, and company size a set of postings pulled from fintech companies in one city will look different from a set pulled from retail companies in another region. That variation is expected and useful information in itself.
AI and Data Analyst Projects in 2026–2027
AI tools have changed how analysts do the mechanical parts of their work, but they’ve also introduced a new category of risk that candidates need to understand and manage in their own projects.
AI-assisted work is now genuinely useful across query drafting, initial data cleaning suggestions, exploratory summarization, documentation drafting, chart generation, and first-pass insight generation. Multiple 2026 industry sources describe this as the “mechanical layer” of analytics work routine SQL, cleaning, and standard charts are increasingly AI-assisted, while judgment-heavy tasks choosing the right question, validating a result against business reality, and being accountable for a recommendation remain squarely human responsibilities, according to Databricks’ analysis of how AI is reshaping the analyst role.
The risks are equally real. Large language models can produce confident, fluent, and completely incorrect output, including invented columns, incorrect joins, or plausible-sounding but wrong calculations. AI-generated analysis can also mistake coincidental correlation for causation, a failure mode that’s less discussed than outright hallucination but similarly consequential for business decisions built on top of it. Sensitive or private data pasted into general-purpose AI tools also raises genuine privacy and governance concerns that a portfolio project should never create, even inadvertently.
The core principle worth internalizing: AI can accelerate analytical work, but it does not remove the need to understand the analysis. A candidate should still be able to independently explain what a query does, sanity-check an AI-generated number against a manual spot-check, recognize when a result contradicts something observable in the data, and take responsibility for the final conclusion regardless of which tool produced the first draft.
If AI assistance was used anywhere in a portfolio project, being transparent about that in the documentation (and being able to explain what was verified manually) is itself a positive signal, not something to hide.
Certifications vs. Projects
Certifications and projects demonstrate different things, and confusing the two leads to portfolios that are heavy on credentials and light on evidence.
A certification can demonstrate structured learning that a candidate worked through a defined curriculum and passed some form of assessment. A project can demonstrate applied capability that a candidate can take an ambiguous, real-world-shaped problem and produce a defensible answer. Neither guarantees an interview on its own.
Certifications can meaningfully complement projects when they fill a specific, verifiable gap (for example, a recognized BI-tool certification alongside a portfolio that already demonstrates strong SQL and analytical reasoning), or when a candidate has no prior work history and needs some form of third-party signal alongside self-directed projects. A certification without any accompanying project evidence is a weaker signal than a strong project without any certification, because the certification alone doesn’t demonstrate what the candidate can do with an ambiguous, real dataset.
Project Portfolio Strategy
Pulling the earlier sections together into a single example strategy: a candidate targeting general data analyst roles might structure a four-project portfolio as follows :
- Project 1: a SQL-heavy analysis emphasizing joins, aggregation, and query documentation.
- Project 2: a Power BI or Tableau dashboard project emphasizing stakeholder-facing reporting and visualization choices.
- Project 3: a Python or statistical analysis project emphasizing deeper analytical reasoning (cohort, segmentation, or basic forecasting).
- Project 4: an end-to-end business analysis project that combines all three skill areas around one coherent business problem, from raw data through to a documented recommendation.
The exact composition should shift based on the target role identified in match projects to Job Descriptions a BI Analyst target role might weight more heavily toward Projects 1 and 2, while a Product Analyst target role might prioritize Projects 3 and 4. The underlying objective throughout is complementary evidence across distinct skills, not simply accumulating more projects.
Data Analyst Portfolio Readiness Checklist
A practical way to assess overall readiness before applying broadly:
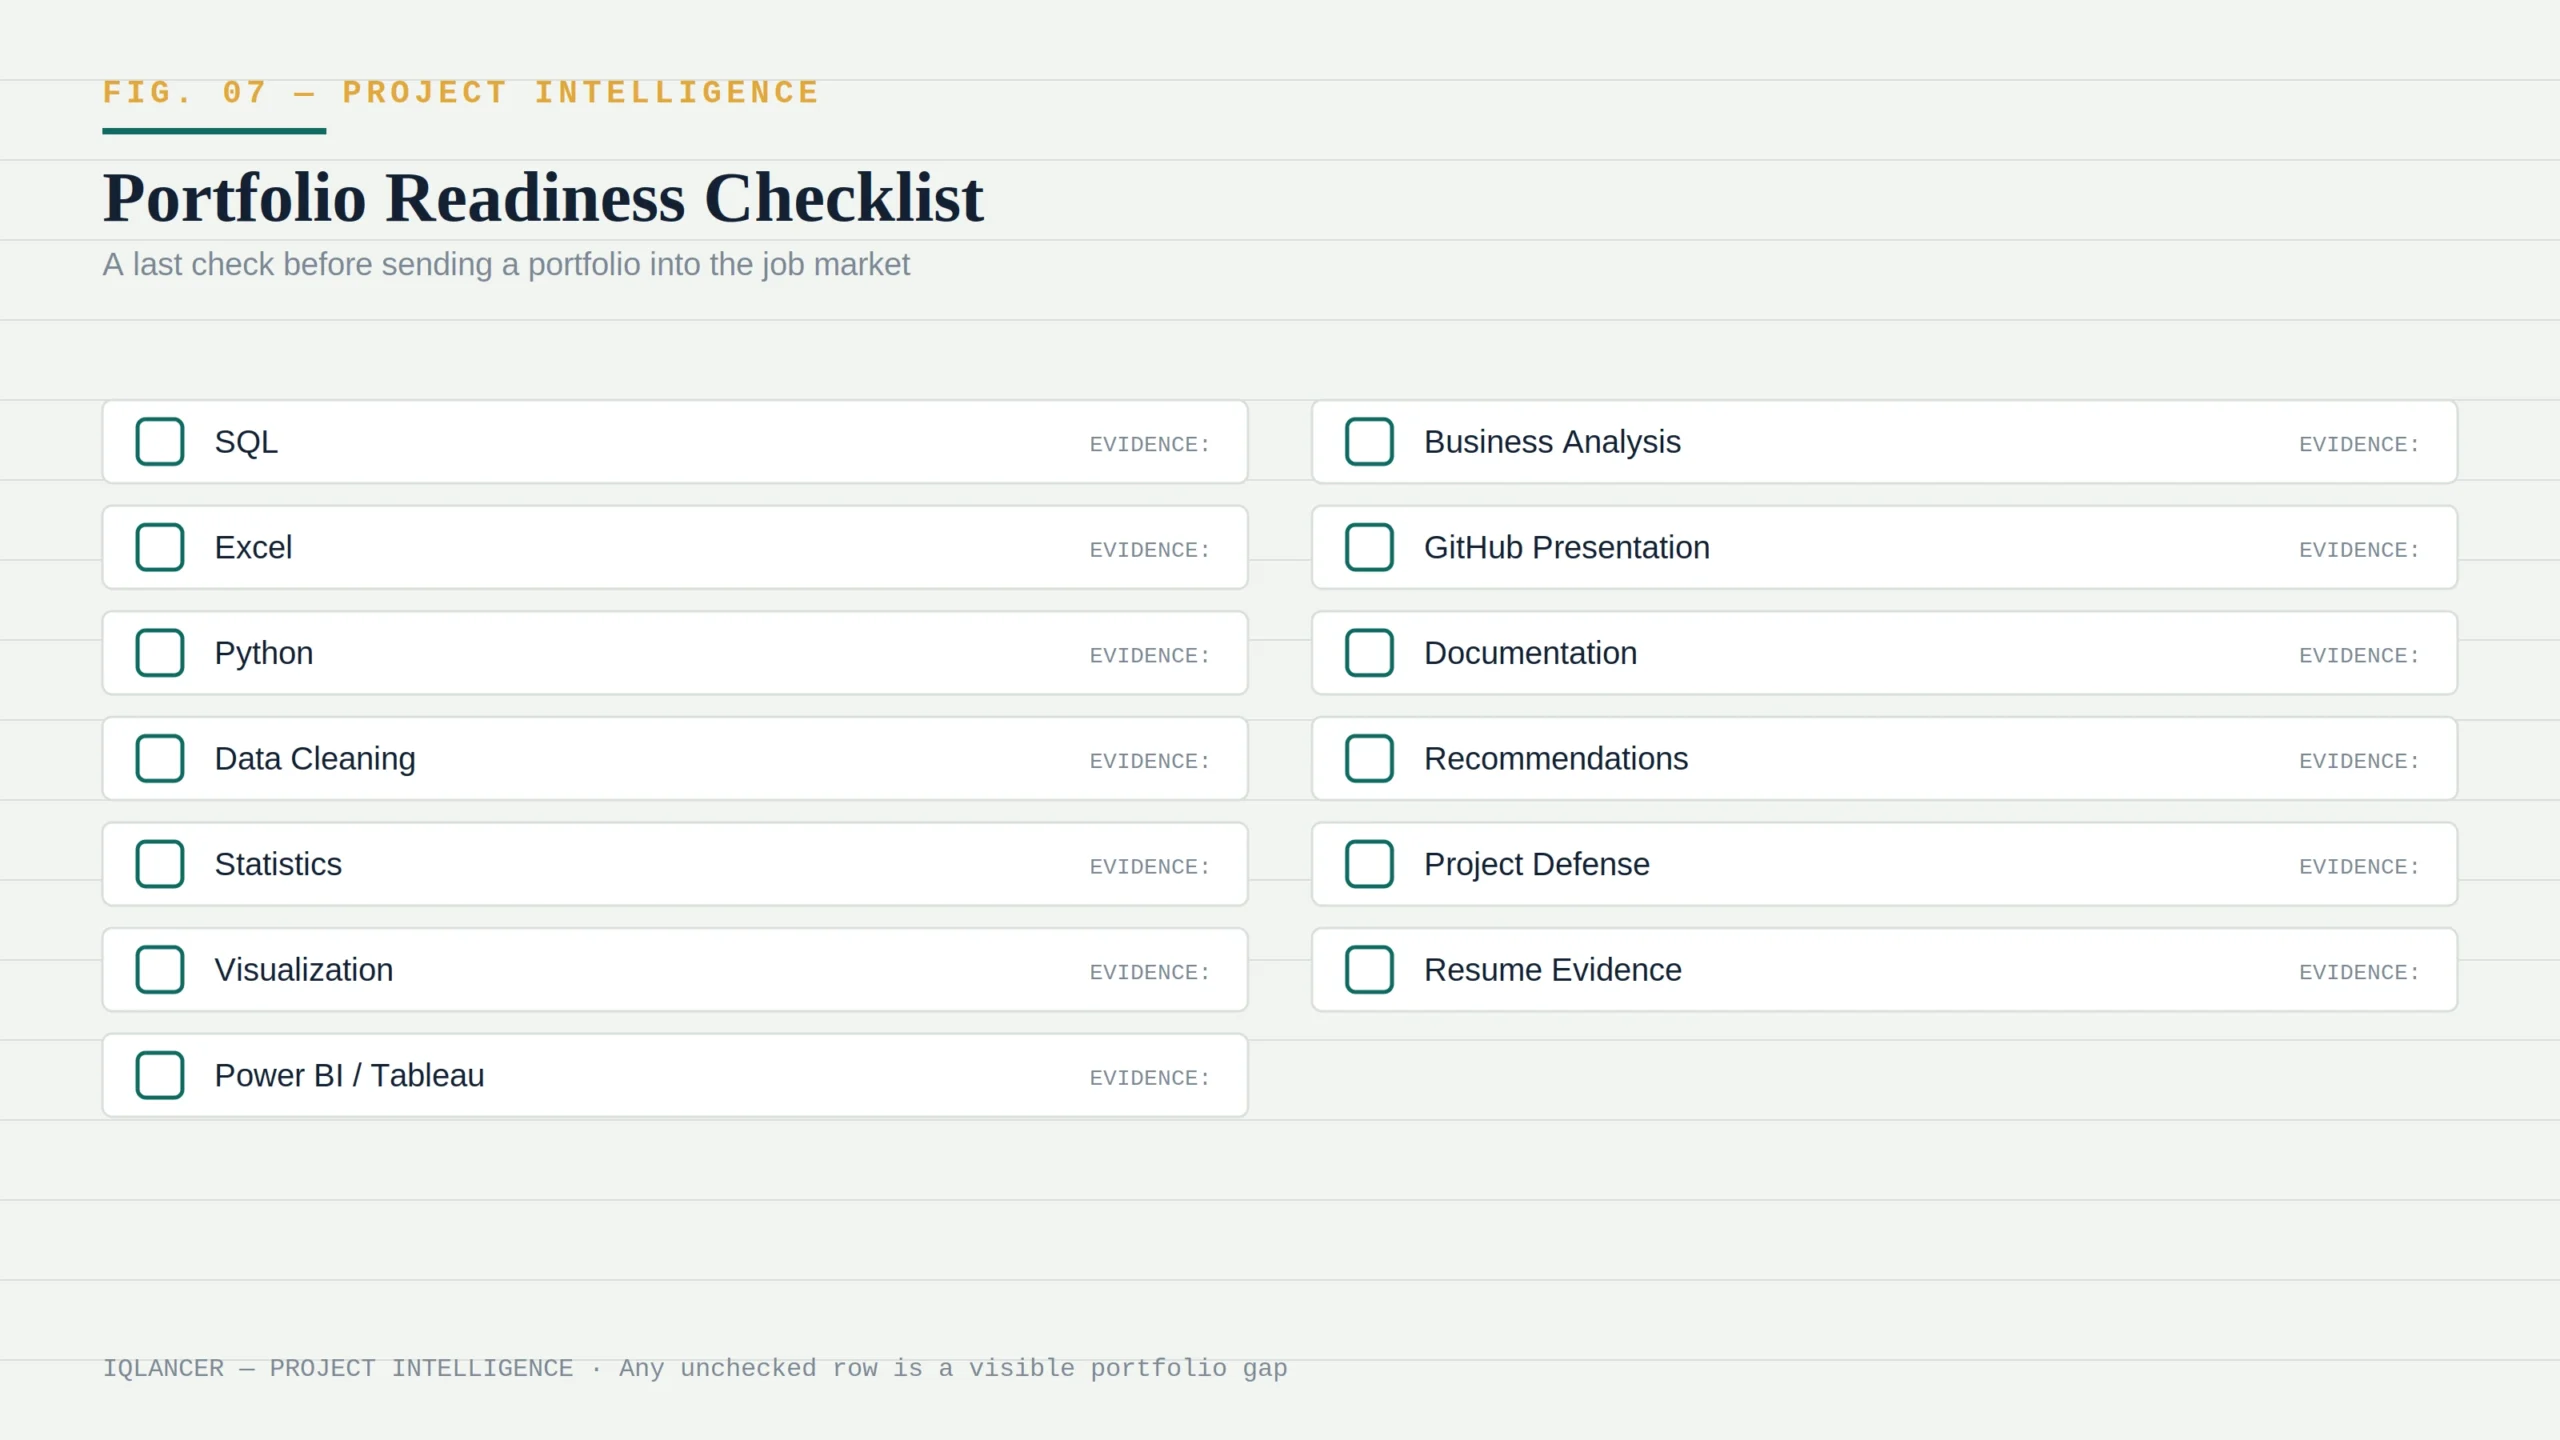
Fill in the “Ready?” column honestly, and use the “Evidence” column to name the specific project that demonstrates each row. Any row without a linked project is a visible gap and, match projects to job descriptions, a candidate list of gaps to close before applying to roles that emphasize that specific skill.
What Should a Candidate Be Able to Prove?
This is the practical conclusion the entire framework has been building toward. Before calling a portfolio finished, a candidate should honestly be able to answer “yes” to most of the following;
- Can I find and understand unfamiliar data?
- Can I clean genuinely imperfect data?
- Can I query data independently using SQL?
- Can I analyze patterns without being told which ones to look for?
- Can I select metrics appropriate to a business question, rather than defaulting to whatever is easiest to calculate?
- Can I build visualizations that communicate a finding rather than just displaying data?
- Can I explain findings clearly to someone without a technical background?
- Can I connect findings to an actual business decision?
- Can I document my methodology so someone else could follow it?
- Can I reproduce my own work if asked?
- Can I defend the assumptions I made?
- Can I explain the limitations of my own analysis honestly?
- Can I use AI tools responsibly, verifying their output rather than accepting it blindly?
- Can I communicate with stakeholders who may disagree with my conclusion?
A portfolio that lets a candidate answer “yes” to this list and prove it, not just assert it is a portfolio built on evidence rather than decoration.
Final Thoughts
Data analyst projects only function as hiring evidence when they demonstrate the full chain from business problem to defensible recommendation not when they demonstrate tool familiarity alone. The strongest data analyst portfolio projects are fewer in number, more differentiated in skill, and documented well enough that someone else could follow the reasoning without help.
Building three or four projects this way, mapped deliberately to a target role’s actual job descriptions, is a more useful use of time than building a dozen shallow dashboards. Before applying broadly, revisit the Data Analyst Portfolio Readiness Checklist identify the weakest row, and rebuild that specific piece of evidence rather than adding another project that repeats a skill already demonstrated.
2 thoughts on “Data Analyst Projects That Help Get Interviews: A Project Intelligence Blueprint for 2027”