A Power BI user can now type a plain-English question and get a chart, the underlying query, and a short explanation. Microsoft’s documentation says Copilot can answer questions using a report’s semantic model and can generate DAX queries for ad hoc calculations. That speed is real. What it does not settle is whether the number is right, whether the question was the right one, or whether the business should act on the answer.
This IQlancer piece is about AI and data analyst jobs, and it keeps three questions apart:
- Task transformation: which individual tasks can AI assist with or automate?
- Role transformation: how might the mix of responsibilities inside analyst roles shift?
- Employment impact: what does the evidence say about hiring and job numbers?
A quick note on terms. Some employers use “AI Data Analyst” as a job title. Here the phrase means ordinary analyst work done with AI tools. The evidence below was reviewed on October 26, 2026, and it comes mostly from US and global sources, plus a small snapshot of Indian job postings.
To keep the discussion concrete, the article uses a simple structure.
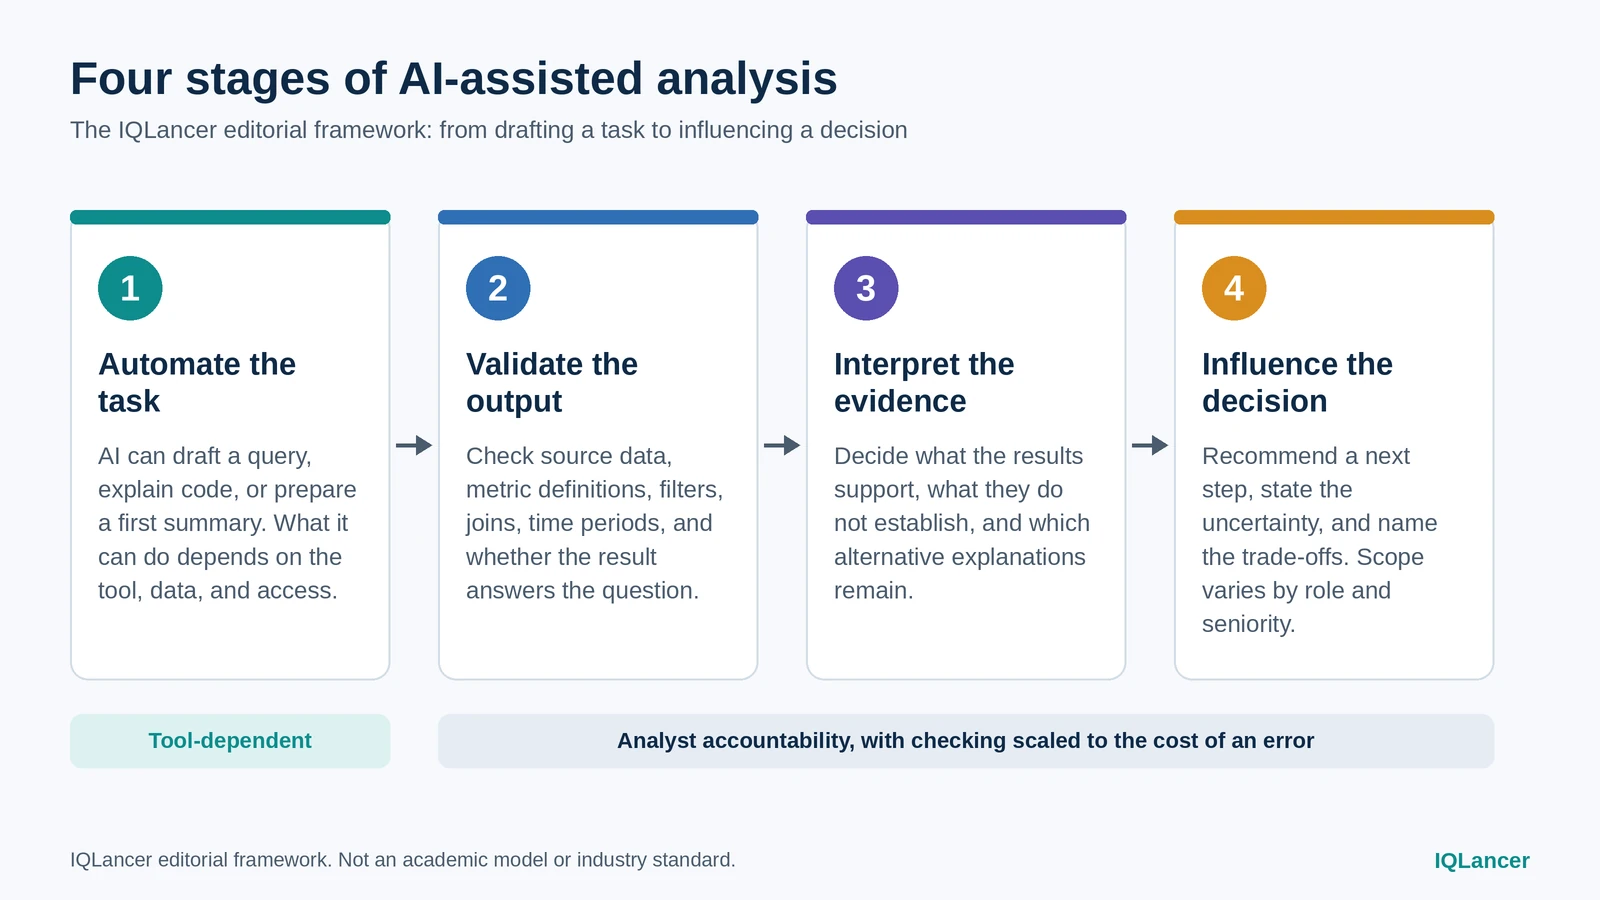
The IQLancer editorial framework: Automate the task → Validate the output → Interpret the evidence → Influence the decision. This is an editorial synthesis for explaining AI-assisted analytical work. It is not an academic model, an industry standard, or an externally validated theory.
Which Data Analyst Tasks Can AI Assist With or Automate?
In the evidence on AI and data analyst jobs, the clearest findings concern tasks: current documentation shows AI assisting with drafting and explaining queries, answering questions about modelled data, building report pages, and summarising results. What a given tool can do depends on its setup, permissions, and how well the data model is prepared.
Microsoft’s Copilot for Power BI is the best-documented example, so this section uses it. Other tools differ, and its limits shouldn’t be read as universal.
- Query writing and explanation. In DAX query view, Copilot can turn a natural-language request into a DAX query, explain an existing query, and explain DAX concepts. It checks the syntax of what it generates and retries once if the syntax is invalid.
- Questions about data. Copilot can answer questions using existing measures and columns in a semantic model, or generate DAX for ad hoc calculations such as year-over-year growth. With Fabric IQ turned on in report viewing mode, it can show its reasoning steps, the DAX query, and the data table behind an answer.
- Reports and summaries. Report authors can use Copilot to create and edit reports, write a summary visual, and write DAX.
Three things shape what this means in practice.
First, setup. Microsoft lists paid Fabric capacity (F2 or higher) or Power BI Premium (P1 or higher), an enabled admin setting, and a supported region. The same page says the report-side Copilot pane is generally available, while the standalone and app experiences are in preview. It also lists India West among regions where the standalone and app experiences aren’t yet available, so Indian readers should check their own tenant.
Second, preparation. Microsoft says that without model preparation, Copilot can misinterpret data and return generic or inaccurate results.
Third, and this is my reasoning, not something the documentation states: a generated query that is syntactically valid can still compute something other than what the business means by a metric.
| Task | How AI may assist | What needs verification | Why business context matters |
|---|---|---|---|
| Drafting a query or DAX measure | Generates a first version from plain language | Joins, filters, date logic, the metric definition used | “Conversion” can have several valid definitions |
| Asking a question of a report | Answers from model measures; can show reasoning | Whether it used the intended measure and period | The question may need reframing |
| Explaining unfamiliar code | Explains DAX in plain language | Whether the explanation matches what the code does | Local naming and conventions |
| Building report pages | Creates and edits report pages | Whether the visuals answer the stakeholder’s question | What the audience will decide with it |
| Summarising findings | Summarises reports and topics | Whether the summary overstates the data | What is safe to say to leadership |
What usage data adds. Anthropic’s first Economic Index report found that AI use leaned toward augmentation (57%) over automation (43%). It also found that only about 4% of occupations used AI for at least 75% of their tasks. A March 2026 update reported that about 49% of jobs had at least a quarter of their tasks performed on Claude.
These figures describe Claude.ai usage across all occupations. They give context for AI and data analyst jobs but are not specific to analysts, and they don’t count jobs gained or lost. Anthropic also makes the tool being measured, so treat the data as supporting context.
What AI Still Cannot Reliably Decide Without Context and Verification
Microsoft’s own documentation marks where context and verification stay necessary: questions that need new insight, answers that depend on model design, and results that may not match what the analyst sees on screen.
These limits are specific to one feature, not to AI in general.
- Questions that need new insight. The Copilot data-questions feature can’t currently answer questions that require anomaly detection, forecasting, or key-influencer analysis. Its own example of an unsupported question is why sales fall every July.
- Page filters. Those answers don’t apply filters or slicers currently affecting visuals on the report page. The number in the chat can differ from the number on the page.
- Fallback to general knowledge. When a question isn’t about the semantic model, Copilot might answer from the language model’s general knowledge.
- Limited data access. For DAX, Copilot uses model metadata, may sample only minimum and maximum values in import mode, and may not know recently added DAX functions. That page shows a December 2024 update date, so check the current state.
Verification should scale with the stakes. Checking an exploratory chart for your own use is not the same as checking a figure going to an executive. Microsoft itself recommends testing a representative set of questions against known, validated results.
Accuracy is part of the occupation. In O*NET’s data for Business Intelligence Analysts, 64% of respondents rated being exact or accurate as extremely important.
One finding cuts the other way. In the WEF skills survey, dependability, attention to detail, and quality control fell in importance compared with 2023. The report doesn’t explain why. One possibility is an expectation that tools handle more checking, but that is speculation. The point is that “validation will matter more” is a reasoned argument, not an established survey result. Any honest account of AI and data analyst jobs has to carry that tension.
A Practical Example: Investigating a Drop in Conversion Rate
Illustrative scenario. This is not a real company, and it contains no real or invented figures. It exists to show the four-stage framework in use.
An online retailer notices that its website conversion rate is lower this month than last. A manager asks the analyst what happened and what to do. The analyst works in a Power BI report built on a semantic model of web events and orders. This is what AI and data analyst jobs look like in daily practice, away from the headlines.
Stage 1: Automate the task
The analyst writes the business question first: what changed, when, for which segments, and what evidence is needed before anyone recommends a fix.
Then the analyst uses AI where the tool supports it. In the report’s Copilot pane, they ask for conversion rate by week, by device, and by channel. Those are the kinds of questions the documentation says are supported, such as a measure split into categories or tracked over time. In DAX query view, they might have Copilot draft a query and explain a measure they didn’t build.
If they ask the tool why conversion fell, they hit the documented boundary: that kind of insight question is listed as unsupported. The tool can describe. It can’t explain.
Stage 2: Validate the output
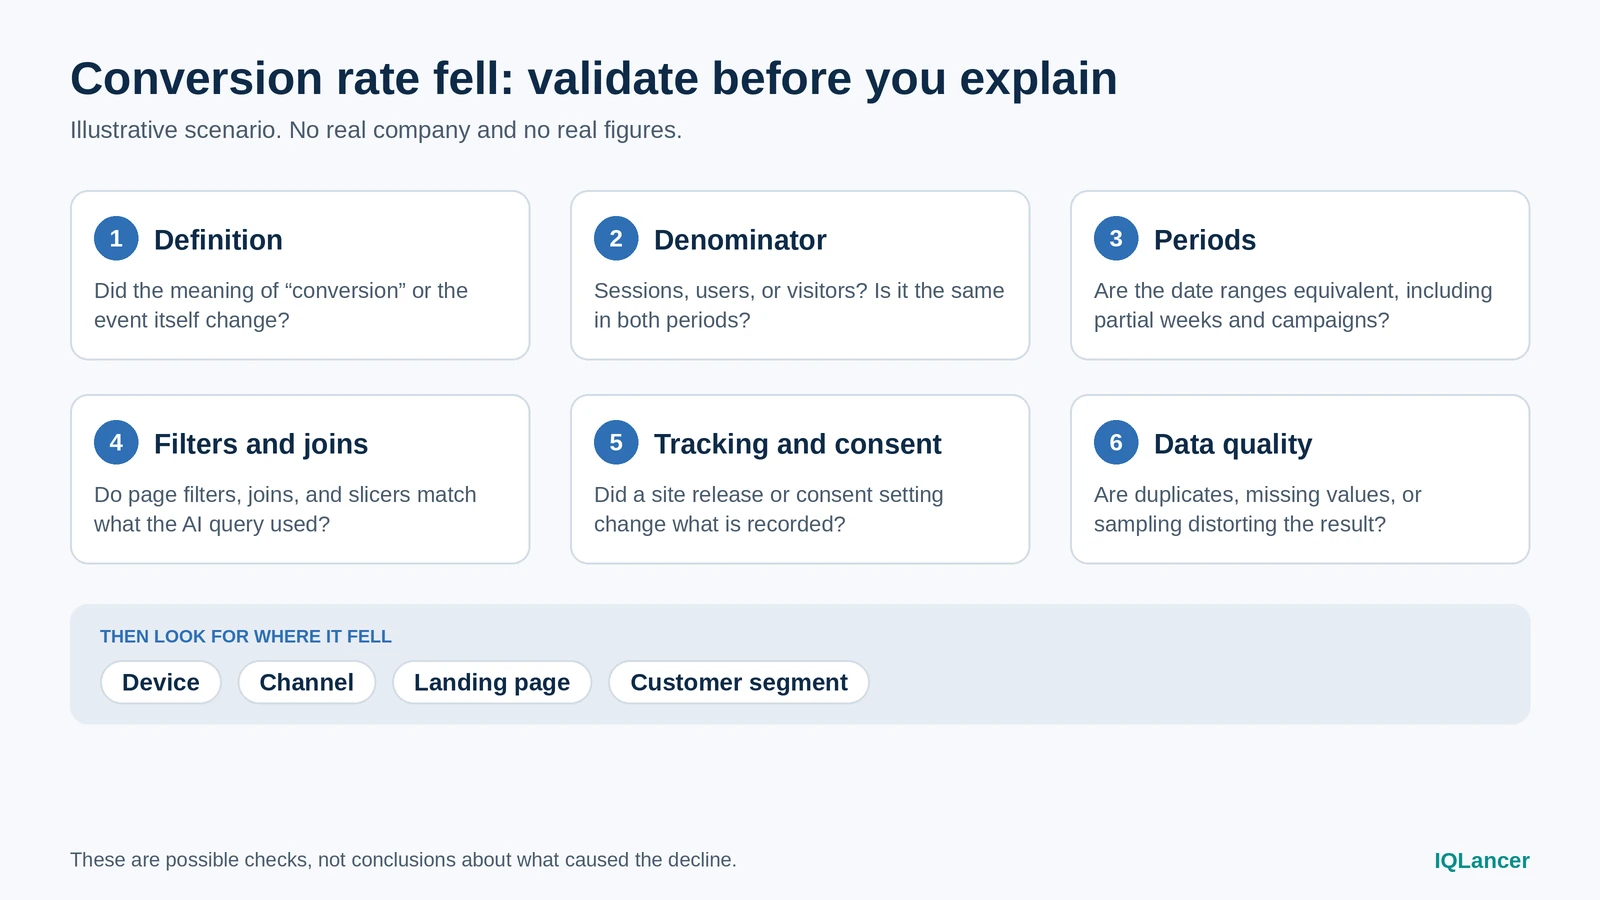
Before trusting any figure, the analyst checks:
- Whether the AI used the organisation’s official conversion measure or invented its own.
- Whether the denominator is sessions, users, or visitors, and whether it changed.
- Whether the two periods are comparable, including partial weeks, month length, and campaigns.
- Whether the page filters matter, given that Copilot’s answers don’t apply them.
- Whether the conversion event is recorded consistently, and whether its definition or tracking changed in a site release.
- Whether consent settings changed what is collected. Google says GA4 models the behaviour of users who decline cookies, when a property is eligible, so reported figures may include estimates.
- Whether duplicates, missing values, or sampling are distorting the result.
These are possible checks, not conclusions about what happened.
Stage 3: Interpret the evidence
The validated data points to several explanations that need testing, not choosing between by instinct:
| Possible explanation | What would support it | What would weaken it |
|---|---|---|
| Measurement problem (a tag broke after a release) | Event counts drop at one step, on specific browsers, starting on the release date | Orders in the transaction system fall by a similar amount |
| Traffic mix shift (more low-intent visitors) | Rates are stable within each channel, but the share of one channel grew | Rates fell inside every channel |
| Site change (a slower or confusing checkout on mobile) | Decline concentrated in one device and page | Desktop and mobile fall equally |
| Demand or seasonality | Similar movement in comparable earlier periods | No such pattern in earlier years |
A decline that begins around a release date is a correlation, not proof of cause. A mix shift can also lower the overall rate while every individual segment stays flat. The analyst separates “plausible” from “tested”.
Stage 4: Influence the decision
The analyst reports what is known, what is not, and what to do next. For example: “The decline is concentrated in mobile checkout. Tracking has not been ruled out as the cause. Before any redesign, we should compare event counts with order records by browser version.”
How far this goes depends on the role. A junior analyst may hand this to a senior colleague. A senior analyst may recommend a test or a rollback. Not every analyst owns the decision.
The career lesson
For AI and data analyst jobs, the lesson is about where AI helped and where it did not. AI helped most at Stage 1, drafting, exploring, and explaining. The tool’s reasoning view can support Stage 2, but a person still decides whether the result is right. Stages 3 and 4 depend on business context, and the documentation shows the tool’s limits there. These stages match O*NET’s description of the work, which includes conducting tests to ensure intelligence matches defined needs, synthesising trends to support recommendations, and interpreting the meaning of information for others.
Which Data Analyst Capabilities May Become More Valuable?
Within AI and data analyst jobs, the evidence supports continued importance for analytical reasoning, accurate data handling, and communicating meaning. It does not show that any of them earns a salary premium, and importance varies by role.
- Problem framing and analytical reasoning. Analytical thinking was the top core skill in the WEF survey, cited by seven in ten companies, and is expected to grow. O*NET lists critical thinking and complex problem solving for BI analysts. The WEF data is global and not analyst-specific.
- SQL, data structures, and data literacy. My reasoning is that these skills let an analyst inspect generated queries, and Copilot exposes its DAX for inspection. In a snapshot of Indian listings, SQL and Power BI were among the most common requirements.
- Data quality, definitions, and validation. Microsoft’s guidance stresses defining business meaning in the model and comparing answers to validated results. The WEF survey’s lower rating for quality control is the counter-signal noted above.
- Statistical reasoning. Copilot’s data-questions feature doesn’t currently cover anomaly detection, forecasting, or key influencers, so those tasks still need other methods or people. That doesn’t show a demand increase.
- Communicating uncertainty. O*NET includes interpreting the meaning of information for others. Whether clients pay more for it is unmeasured.
- Working with AI tools. Anthropic’s March 2026 report found experienced users had roughly 4 percentage points higher conversation success after controls. Success there is Claude’s own rating, and the finding may reflect who the early adopters are. It suggests tool skill is learnable, not that it is mandatory.
A reporting analyst, a product analyst, a finance analyst, and a BI developer lean on these capabilities differently.
What Does the Evidence Say About AI and Data Analyst Jobs, Hiring, and Entry-Level Work?
The available evidence does not show that AI has eliminated entry-level analyst jobs, and it can’t rule out changes. Direct evidence on analyst hiring is thin.
What current postings show. This is a snapshot, not a trend.
- Walmart Global Tech’s “Data Analyst, Finance”, Chennai or Bangalore, dated April 12, 2026 on a mirror site, asks for 5 to 7 years of experience. It lists “demonstrated experience using AI tools (such as Copilot, GPT…)” alongside Power BI, advanced SQL, data governance, and stakeholder engagement. It is a senior-level role, so it says nothing about entry level, and I can’t confirm it is still open.
- On Weekday’s Power BI listing page (accessed October 24, 2026), Cushman & Wakefield’s “BI Analyst” (Bangalore, on-site, 3+ years) lists Power BI, DAX, SQL, data modeling, and data governance. The excerpt shown doesn’t mention AI. Neuron7.ai’s “Senior Data Analyst” (Bangalore, hybrid, 4+ years) lists SQL, Python, Power BI or Tableau, and data quality checks.
- The same page’s filter tagged 54 of 562 listings as 0 to 1 year of experience. Without an earlier snapshot, that says nothing about direction.
Three postings give only a thin view of AI and data analyst jobs in India, and they can’t show whether requirements are changing.
What employment data shows. BLS projects 33.5% growth for data scientists and 21.5% for operations research analysts, 2024 to 2034. Those are US projections for other occupations, not Data Analyst figures and not India. The mapping problem is real: O*NET’s page for BI Analysts shows wage and employment data for Data Scientists.
What surveys show. The WEF survey expects AI and big data to be the fastest-growing skills by 2030. It is a global forecast, not a measurement of analyst demand.
Reasoned implications. If AI drafts first-pass queries and reports, some junior work may shift toward checking, documenting, and explaining. That is an inference, not a documented change.
Open questions. Whether analyst hiring volume has changed. How employers handle entry-level training. Whether AI skill requirements are rising over time.
For entry-level readers, the supportable takeaway is narrow: be able to show how you checked an analysis, not only that you produced one.
What Should Data Analysts Demonstrate in an AI-Assisted Workplace?
In AI and data analyst jobs, credible evidence of ability is an analysis someone else can audit. It shows the question, the method, the checks, the limits, and the recommended next step.
Using the conversion scenario, that looks like this:
- A defined question. “What changed, when, for whom?” instead of “analyse conversion.”
- A reconciled figure. If an AI-generated number differs from a trusted source, document the gap and its cause.
- A visible check list. Definition, denominator, period, filters, tracking.
- A stated limit. One sentence on what the data cannot establish.
- A proportionate next step. The cheapest test that separates the leading explanations.
A practical habit is a short verification log for any AI-assisted analysis: what the tool produced, what you checked, what you changed, and what remains uncertain. In an interview, walking through a scenario like the one above shows more than naming tools.
What the Evidence Suggests About AI and Data Analyst Jobs in 2027
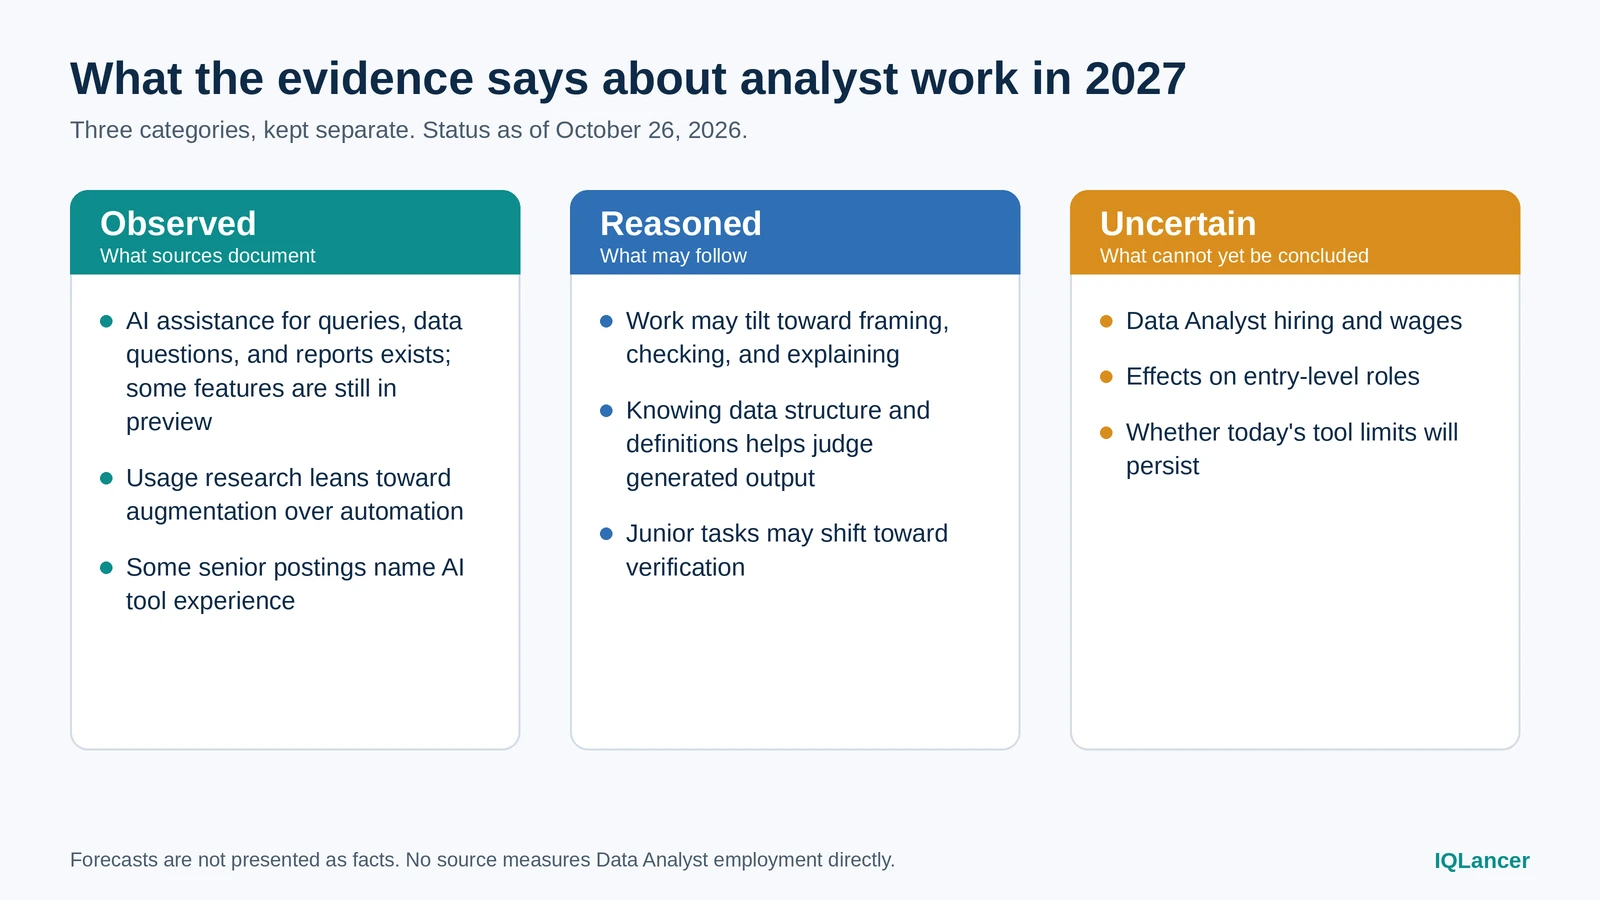
Observed (as of October 2026).
- AI assistance for queries, questions, and reports exists, and some of it is generally available while other parts are in preview (Microsoft).
- Usage research shows AI used for augmentation more than automation, with broad but partial task coverage.
- At least one senior posting names AI tool experience as a requirement.
Reasoned implications.
- For AI and data analyst jobs, the mix of work may tilt toward framing, checking, and explaining.
- Understanding data definitions and structure probably remains necessary for judging generated output.
Uncertainties.
- Hiring, wages, and the future composition of analyst roles. No source I found measures these directly for Data Analysts.
- Whether the limits in today’s documentation will persist as products change.
Frequently Asked Questions About AI and Data Analyst Jobs
Will AI replace Data Analysts? No source I found shows that. Usage data shows task-level use and finds no evidence of whole jobs being automated in its dataset, but it doesn’t measure employment. Roles can still change.
Which Data Analyst tasks are easiest to automate? Those with clear inputs and checkable outputs, such as drafting a query on a well-prepared model or summarising a report. Microsoft says preparation affects reliability.
Do Data Analysts need to learn AI tools? Some employers ask for it, as in the Walmart listing, but the evidence doesn’t show it is universal.
Is SQL still useful? Probably, as the means of checking what a tool produced. That is my reasoning, supported by SQL’s frequency in current listings.
Will AI change entry-level Data Analyst jobs? Nobody can say yet. Evidence on AI and data analyst jobs at entry level is limited, and while tasks may shift toward verification, no source I found measures it.
Focus on the Quality of the Analysis, Not Just the Speed of the Output
AI and data analyst jobs are linked mainly through the tasks inside those jobs. The evidence shows tools speeding up drafting and exploration. It also shows limits that keep verification, interpretation, and communication in human hands for now. Employment effects are not yet measured well enough to forecast.
Producing an answer is not the same as producing reliable analysis. The analyst’s value sits in the gap: checking the answer, understanding what it supports, and helping a business decide what to do. IQLancer’s aim as a Career Intelligence platform is to help you read roles by what the work involves, so your decisions about AI and data analyst jobs rest on responsibilities, not headlines.
1 thought on “AI and Data Analyst Jobs: How the Work Is Changing in 2026-2027”