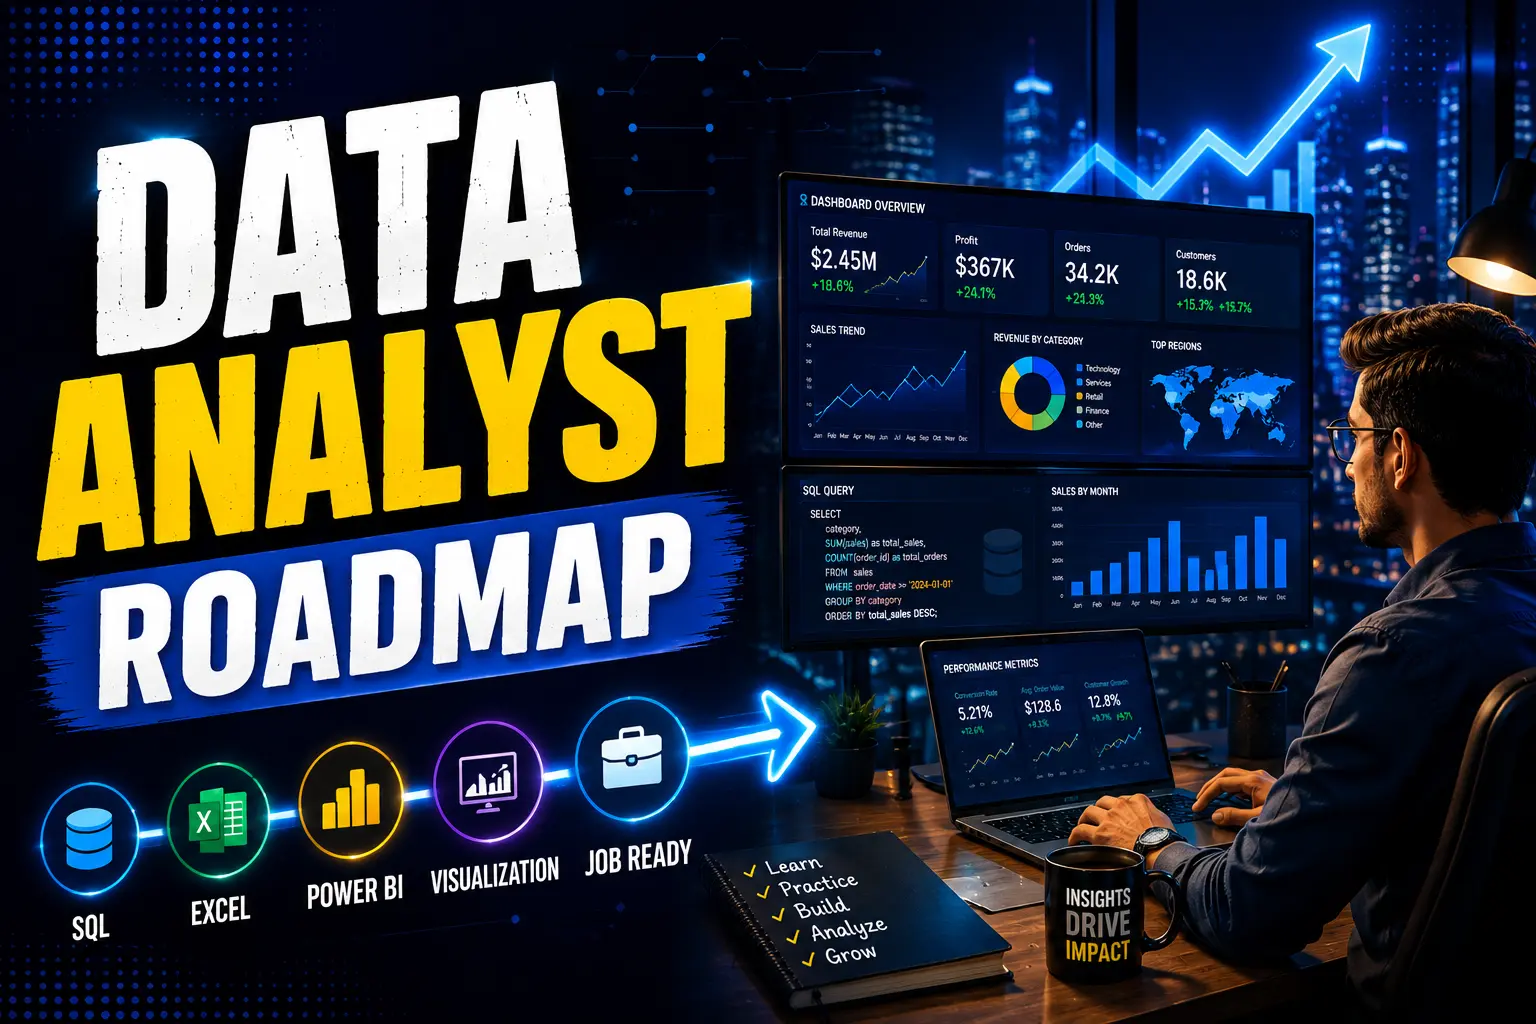
Every business now runs on data, but most candidates still don’t know how to become a data analyst in a way that actually gets them hired. Data analytics remains one of the most accessible entry points into tech because it doesn’t demand a computer science degree. It demands proof that you can turn raw numbers into decisions.
Yet thousands of candidates apply every month with certificates and no portfolio, or strong Excel skills and no SQL, and get filtered out before a recruiter ever reads their resume. This blueprint breaks the process down the way a hiring manager actually evaluates it: skills, projects, certifications, experience expectations, and the specific mistakes that separate selected candidates from rejected ones.
What Does a Data Analyst Do?
Recruiters rarely reject candidates for not knowing the definition of a data analyst; they reject candidates who can’t explain what the role actually involves day to day. Understanding the real workflow is the first competitive advantage.
A data analyst’s core job is to take messy, disconnected data and turn it into something a business team can act on. That usually means:
- Pulling data from databases using SQL, or from spreadsheets, CRMs, and internal tools
- Cleaning and structuring data so it’s usable removing duplicates, fixing formatting, handling missing values
- Building dashboards and reports in Power BI, Tableau, or Excel that stakeholders can check on their own
- Running descriptive statistics to explain what happened (not predictive modeling, which is closer to a data scientist’s job)
- Presenting findings to non-technical teams marketing, operations, finance, product in language they can act on
A practical example: a retail company’s marketing team wants to know why conversion rates dropped last quarter. A data analyst doesn’t guess. They pull transaction and campaign data, segment it by channel and region, identify that mobile conversions fell specifically in one city after a checkout page change, and present that finding with a chart and a one-line recommendation. That’s the actual job not “analyzing data” in the abstract, but answering a specific business question with evidence.
Industries hiring analysts at scale include e-commerce, banking and financial services (BFSI), healthcare, SaaS, logistics, and consulting. Each industry expects slightly different domain knowledge, but the core toolkit SQL, a BI tool, and business communication stays constant across all of them.
Is Data Analytics a Good Career in 2026-2027?
Candidates researching how to become a data analyst usually want reassurance the field will still be hiring by the time they’re job-ready and that’s a fair question given how much AI has changed entry-level tech hiring.
The honest answer: data analytics remains one of the more stable entry paths into tech, but the bar for “entry-level” has risen. Industry hiring trackers point to continued double-digit growth in analytics roles across BFSI, e-commerce, and healthtech, driven by companies formalizing data-driven decision-making rather than treating it as optional. That demand hasn’t disappeared; it has shifted in what it expects from candidates.
AI tools like Copilot, ChatGPT-style assistants, and automated BI features can now write basic SQL queries and generate simple charts. This has genuinely reduced demand for analysts who can only do “query and export” work. What it has not reduced is demand for analysts who can interpret results, catch a flawed assumption in a dashboard, translate a vague business question into a measurable one, and explain trade-offs to a non-technical stakeholder. AI has made the mechanical parts of the job faster; it has made the judgment parts of the job more valuable, not less.
The practical implication for anyone starting now: treat AI tools as part of your workflow from day one use them to speed up query writing or data cleaning but invest your actual learning time in the parts AI can’t replace: business framing, statistical reasoning, and communication.
Candidates who position themselves as “I can use AI to work faster” rather than “I compete with AI” are the ones getting shortlisted in 2026-2027.
Which Degree Is Required to Become a Data Analyst?
This is one of the most googled questions in the field, and also one of the most misunderstood, because the honest answer depends heavily on the type of company doing the hiring.
Technical degree backgrounds (B.Tech, Computer Science, Statistics, Mathematics) get an easier initial screen, especially at product companies and larger tech firms that use degree as a coarse filter for high application volumes. This doesn’t mean they win the job; it means their resume survives the first filter more reliably.
Commerce and business backgrounds (B.Com, BBA, Economics) are genuinely common among working data analysts, particularly in BFSI, retail analytics, and business intelligence roles, because these candidates already understand business metrics like revenue, margin, and churn something a purely technical graduate often has to learn on the job.
Non-technical graduates (Arts, Humanities, unrelated fields) can and do break into data analytics, but they carry a heavier burden of proof. Recruiters at this level will almost always ask for a portfolio before they trust a resume with no technical degree and no work history in data.
Self-taught and career-switcher pathways work when backed by demonstrable proof certifications completed with a real capstone project, a GitHub with actual analysis work, and ideally one relevant internship or freelance project. What doesn’t work is a certificate alone with nothing built on top of it.
The hiring reality: degree opens the door to the interview faster at some companies, but skills and portfolio decide whether you get the offer at almost all companies. If your degree isn’t technical, your project portfolio needs to work twice as hard to compensate.
Skills Required for Data Analysts
Skills required for a data analyst role are evaluated far more specifically than most candidates assume recruiters aren’t checking a box that says “knows SQL,” they’re checking whether you can perform the exact operations their job description lists, which is why generic self-study rarely converts into interview calls.
Technical Skills
SQL Most entry-level data analyst job descriptions expect candidates to perform JOINs, GROUP BY aggregations, window functions, subqueries, and filtering logic not just simple SELECT statements. Interviewers commonly test this with a live query exercise or a take-home dataset. Candidates who only know basic SELECT and WHERE clauses consistently fail this stage. Build this skill by solving real query problems on datasets with multiple related tables, not just tutorial exercises with a single flat table.
Excel Even with Power BI and Tableau available, Excel remains a daily tool at most companies because business teams live in it. Recruiters expect PivotTables, VLOOKUP/XLOOKUP, conditional formatting for quick visual checks, and the ability to build a clean summary report without a BI tool. Candidates who can only make charts but can’t structure a workbook someone else can navigate are a common rejection reason at smaller companies.
Power BI / Tableau Dashboard tools are now a baseline expectation, not a differentiator but recruiters distinguish between candidates who can drag fields onto a canvas and candidates who understand dashboard design: what to show a CEO vs. an operations manager, how to avoid cluttered visuals, and how to build interactivity with filters and drill-downs. One well-designed, business-relevant dashboard in your portfolio outweighs five generic ones.
Python Python is increasingly listed in job descriptions, but at the analyst level it’s usually about pandas for data manipulation, basic visualization libraries, and simple automation not machine learning. Candidates aiming for the analyst-to-data-scientist transition benefit most from strengthening Python early, since it becomes essential the moment role scope expands.
Statistics Descriptive statistics (mean, median, distribution, correlation vs. causation) come up constantly in interviews, particularly through scenario questions like “how would you know if this trend is meaningful or noise?” Candidates who can’t distinguish correlation from causation in an interview answer are flagged immediately by experienced interviewers this is one of the fastest ways to lose credibility in a technical round.
Business Skills
Recruiters evaluate whether a candidate can connect a number to a business decision. A candidate who says “sales dropped 12%” adds little value. A candidate who says “sales dropped 12%, concentrated in the 25–34 age segment after the pricing change in March, and here’s what I’d test next” demonstrates business skill. This is developed by practicing with real business questions on your portfolio projects, not just technical exercises.
Communication Skills
Every stage of the interview process the take-home assignment review, the case study round, the final interview tests whether you can explain technical work to someone non-technical. Candidates lose offers regularly not because their analysis was wrong, but because they explained it in a way only another analyst could follow. Practice explaining your project findings out loud in two minutes, assuming your audience has never seen the dataset.
Together, this is the practical foundation covering the skills required for data analyst roles across freshers, working professionals, and career switchers and it’s also the exact list recruiters use, consciously or not, to shortlist and reject resumes.
Data Analyst Certifications That Can Help
Certifications get debated constantly, and the honest hiring reality is more nuanced than “worth it” or “waste of time”. It depends on what stage of your career you’re at and what you build alongside the certificate.
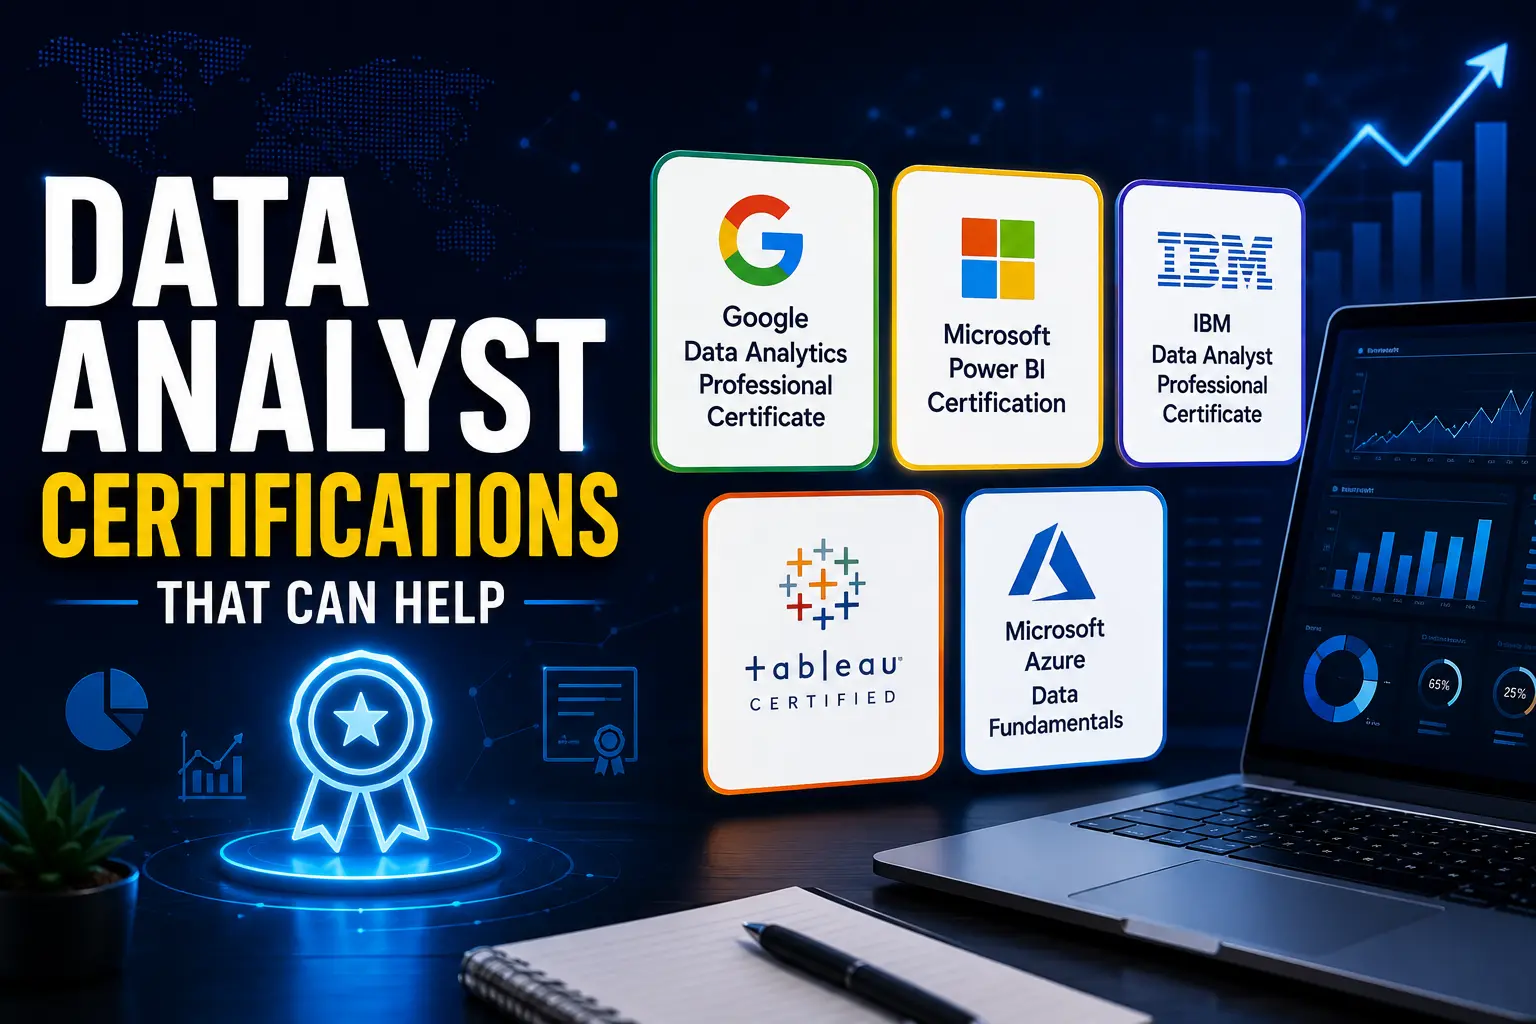
Google Data Analytics Professional Certificate This remains the most recognized entry-level certificate for career changers and complete beginners, built around a structured curriculum ending in a capstone project.
Employer awareness of this certificate has grown enough that it’s increasingly listed as an accepted alternative to a degree in some entry-level job postings. Its real career value comes from the capstone project, not the certificate badge learners who pair it with structured career coaching and a real portfolio see meaningfully better outcomes than those who complete it as a checklist alone. Its main limitation is that it teaches R rather than Python, so most graduates need to supplement it with independent Python practice.
Microsoft Power BI Certification This is a strong, fast credential specifically for candidates targeting BI-heavy analyst roles, especially at companies already standardized on the Microsoft data stack. Its hiring impact is narrower than the Google certificate; it proves tool proficiency, not overall analytical capability; so it works best as a supplement to SQL skills, not a replacement for them.
IBM Data Analyst Professional Certificate Comparable in structure to the Google certificate, with slightly heavier emphasis on Python and some exposure to basic data visualization libraries. It’s a reasonable alternative for candidates who want Python coverage from the start rather than adding it separately.
Tableau Certifications Useful for candidates targeting roles at companies that specifically use Tableau over Power BI common in consulting and larger enterprises. Less broadly useful than SQL or Power BI skills if you’re applying broadly rather than to Tableau-specific job postings.
Azure Data Fundamentals Valuable for candidates aiming at analyst roles inside larger organizations moving their data infrastructure to the cloud, or for candidates who want to signal readiness for analytics engineering or BI engineering as a next career step. It’s not a requirement for most entry-level analyst postings today, but it’s a differentiator when it appears alongside SQL and BI tool skills.
For candidates weighing multiple options at once, independent comparisons of Google, IBM, Meta, and university-backed certificates are a useful way to check hiring value before committing months to any single path.
The hiring reality on certifications: none of them get you hired on their own. What they do is get your resume past automated filters that scan for keywords, and give you a structured way to build the actual portfolio project a recruiter wants to see. A certificate with no project behind it signals that you completed a course. A certificate with a strong capstone project signals that you can do the job. Recruiters can tell the difference in the first two interview questions.
These data analyst certifications matter most when they’re the vehicle for building something real — not the end goal by themselves.
How Many Projects Are Needed to Become Competitive?
Portfolio strength is one of the biggest gaps between candidates who get shortlisted and candidates who get filtered out silently, which is exactly why this section gets more attention than almost anything else in this guide.
Minimum project expectations: For freshers and career switchers, 3–4 solid projects are enough to be competitive quality and depth matter far more than quantity. Ten shallow projects copied from tutorials are worth less than two projects that show a real analytical process: a clear business question, data cleaning, analysis, a dashboard, and a written conclusion with recommendations.
GitHub expectations: Your GitHub doesn’t need to look like a software engineer’s ; but it needs a clean README for each project explaining the problem, your approach, the tools used, and what you found. A repository with only raw code and no explanation gets skipped by recruiters in seconds, because they’re scanning dozens of profiles and won’t reverse-engineer your logic.
Dashboard requirements: At least one project should include a polished, interactive dashboard (Power BI or Tableau) that someone unfamiliar with the dataset could use to answer their own questions not just a static chart. This is usually the single most-clicked link on a data analyst portfolio during screening.
A practical project tier structure
Beginner projects : Clean and analyze a single dataset (sales data, survey data, a public dataset from Kaggle) and answer 3–5 specific business questions with charts. Purpose: prove basic SQL/Excel/Python competency.
Intermediate projects : Combine multiple related tables (e.g., customers, orders, and products) using SQL JOINs, build a full interactive dashboard, and write a business-facing summary of findings. Purpose: prove you can handle the messiness of real business data, not just a single clean CSV.
Advanced projects : Take an ambiguous, open-ended business problem (e.g., “why is customer retention declining”) and design your own analytical approach from scratch, including deciding what data and metrics matter. Purpose: prove you can operate with the kind of ambiguity a working analyst actually faces, which is what separates a strong portfolio from a tutorial-following one.
What recruiters actually evaluate isn’t whether you used the “right” tool; it’s whether your project shows a real thought process: why you chose that dataset, what question you were trying to answer, what you found, and what you’d recommend. A project without a clear “so what” at the end reads as an exercise, not an analysis.
What Do Employers Actually Look For?
Every candidate researching how to become a data analyst eventually asks the same underlying question: what actually gets weighted in the hiring decision, once the resume clears the first filter?
In roughly this order of practical weight during interviews:
- SQL proficiency : usually tested directly with a live exercise or take-home query set
- Analytical thinking : tested through case-style questions (“how would you investigate X drop in Y metric?”)
- Dashboard creation : evaluated through your portfolio or a take-home dashboard task
- Business understanding : tested by asking you to interpret a result, not just produce one
- Communication ability : evaluated throughout every round, not just in a dedicated “communication” interview
- Problem-solving under ambiguity : tested by giving you an intentionally vague business question and watching how you narrow it down
Projects vs. Certifications: Certifications get your resume through automated filters. Projects get you through human interviews. Both matter, but if you have to choose where to invest more time, a strong project outweighs an additional certificate almost every time past the beginner stage.
Skills vs. Degrees: A technical degree helps at the resume-screening stage, especially at large companies with high application volumes. Past that stage, skills and how you demonstrate them in interviews matter more than where you studied; this is one of the more consistent hiring realities across company sizes.
Portfolio vs. Resume: Your resume gets you the interview. Your portfolio gets you the offer. Candidates frequently over-invest in resume formatting and under-invest in the two or three projects a hiring manager will actually click on.
Understanding how to become a data analyst who gets hired not just one who completes courses comes down to matching your preparation to this exact order of evaluation, rather than assuming certificates alone will carry you through.
How Much Experience Is Needed?
Expectations shift meaningfully at every career stage, and candidates frequently misjudge what’s expected of them at their current level either underselling themselves or applying for roles they’re not yet ready for.
Freshers
Expected to know SQL fundamentals, Excel, and at least one BI tool, backed by 3–4 portfolio projects. Not expected to have production experience or advanced statistics but expected to explain their project decisions clearly and confidently.
1–3 Years
Expected to work independently on assigned business questions without heavy supervision, write more complex SQL (window functions, CTEs, subqueries), and start owning a dashboard or reporting area end-to-end. This is typically the fastest salary-growth window in the entire career path, because analysts who upskill and move roles during this stage see the largest jumps.
3–5 Years
Expected to lead analysis on ambiguous, cross-functional business problems, mentor junior analysts, and often start specializing toward BI engineering, deeper Python/statistical work, or a specific business domain (marketing analytics, product analytics, risk analytics). Analysts at this stage who haven’t broadened beyond basic reporting tend to plateau.
5+ Years
Expected to operate closer to strategy deciding what should be measured in the first place, not just answering questions handed down from other teams. This is where the career path typically forks toward Analytics Manager, Senior BI roles, or a lateral move into Data Science or Data Engineering, depending on which skills were built up over the previous years.
Data Analyst Salary in India
Compensation expectations shape how candidates negotiate offers and plan their next 2–3 years, so it’s worth being precise about ranges rather than relying on a single inflated number seen in an ad.
Based on current industry salary trackers for 2026, compiled from Glassdoor, AmbitionBox, and 6figr data:
| Experience Level | Typical Annual Salary (CTC) | Notes |
|---|---|---|
| Fresher (0 years) | ₹3.5 – 6 LPA | Service companies (TCS, Infosys, Wipro) sit at the lower end; product companies and funded startups at the higher end |
| Fresher with strong portfolio (SQL + Python + projects) | ₹6 – 8 LPA | Achievable at product companies with a demonstrated skill portfolio |
| 1–3 years | ₹6.5 – 10 LPA | Fastest growth window; job-switching typically outpaces internal hikes significantly |
| 3–5 years | ₹9 – 15 LPA | Specialization and tool depth (Python, cloud, advanced SQL) create meaningful separation |
| 5+ years / Senior / Lead | ₹15 – 25+ LPA | Varies heavily by company type, with product and global companies at the top end |
City impact: Bengaluru and Hyderabad consistently pay above the national average, typically in the 15–18% range, followed by Delhi NCR, Mumbai, and Pune a pattern that holds across most city-wise salary breakdowns for 2026.
What actually moves salary growth: Internal annual hikes at most Indian companies average in the single-to-low-double digits. The candidates who reach ₹10 LPA+ fastest are typically the ones who change companies every 18–24 months in their first few years, rather than waiting for internal promotions. This is a hiring-market reality more than a company-loyalty judgment ; it’s simply how compensation bands work across the industry.
Skill impact on pay: Candidates with SQL, Python, and a BI tool together consistently earn more than peers with only SQL and Excel at the same experience level ; the gap is meaningful enough that it’s worth prioritizing Python earlier rather than treating it as optional.
The data analyst salary trajectory rewards skill-stacking and strategic job changes far more than it rewards tenure alone a fact many candidates only realize a few years too late.
Why Data Analyst Candidates Get Rejected
Understanding rejection patterns is more useful than generic interview tips, because most candidates repeat the same avoidable mistakes across dozens of applications without realizing it.
- Weak SQL skills : Candidates who can explain SQL in theory but freeze during a live query exercise are one of the most common rejection points at the technical screening stage.
- No practical projects : A resume listing “SQL, Excel, Power BI” with no portfolio link gives a recruiter nothing to verify, and in a competitive applicant pool, unverifiable claims get skipped.
- Generic resume : Resumes that list tools without context (“Proficient in SQL, Excel, Tableau”) rather than outcomes (“Built a sales dashboard reducing manual reporting time by 5 hours/week”) blend into every other applicant’s resume.
- Poor communication : Analysts who can produce correct results but can’t explain them clearly to a non-technical interviewer are frequently rejected at the final round, even after passing the technical screen.
- Lack of business understanding : Candidates who treat every project as a pure technical exercise, without connecting it to a business outcome, read as junior even after years of experience.
- Weak portfolio : Projects that are clearly copied from a tutorial with no original questions or business framing are recognizable to experienced interviewers almost immediately.
7 Mistakes That Prevent Candidates From Getting Hired
- Learning tools in isolation instead of together. Candidates often master SQL, then Excel, then Power BI as separate, disconnected skills. Recruiters test whether you can move data through SQL into a BI tool as one workflow practicing tools in isolation leaves this gap exposed in interviews. Fix: build projects that force you to pull, clean, and visualize data in a single pipeline.
- Treating certifications as the finish line. Completing a certificate feels like progress, but without a project attached, it adds little interview value. Fix: treat every certification’s capstone as the real deliverable, not the certificate itself.
- Copying tutorial projects without modification. Recreating the exact same Kaggle Titanic or Netflix dataset project everyone else has done signals low initiative. Fix: pick a dataset and ask your own original business question that a tutorial wouldn’t cover.
- Applying broadly with the same generic resume. Sending an identical resume to BFSI, e-commerce, and healthtech roles ignores that each industry weighs domain context differently. Fix: tailor 2–3 resume bullet points per application to match the specific job description’s language and priorities.
- Skipping the “so what” in every project. Presenting a chart without a recommendation attached leaves the analysis unfinished in a recruiter’s eyes. Fix: end every project with a one-paragraph business recommendation, not just a visualization.
- Underestimating the communication round. Candidates over-prepare for technical rounds and under-prepare for explaining their own projects clearly. Fix: practice a two-minute walkthrough of each portfolio project aloud, aimed at a non-technical listener.
- Staying too long in one role expecting internal recognition. Waiting years for an internal promotion, when the market consistently rewards job changes with larger salary jumps, is one of the most common reasons experienced analysts feel underpaid. Fix: benchmark your market rate every 12–18 months and treat external offers as a legitimate part of your career strategy, not disloyalty.
Data Analyst Career Path and Growth Opportunities
The data analyst career path isn’t a single ladder; it branches, and understanding the branches early helps candidates choose which skills to prioritize years before the decision point actually arrives.
Standard progression:
- Junior Data Analyst : Supports senior analysts, handles defined reporting tasks, builds foundational SQL and dashboard skills
- Data Analyst : Owns specific reporting areas or business questions independently
- Senior Data Analyst : Leads analysis on ambiguous, cross-functional problems and mentors juniors
- Business Intelligence Analyst : Specializes in building and maintaining the dashboard/reporting infrastructure organizations rely on
- Analytics Manager : Moves into people leadership, prioritization, and translating business strategy into analytics roadmaps
Alternative paths from a Data Analyst base:
- Data Scientist : Requires deepening statistics, machine learning, and Python significantly beyond analyst-level requirements
- Product Analyst : Shifts focus toward user behavior, funnels, and product metrics, common in SaaS and consumer tech
- Data Engineer : Shifts focus toward the infrastructure and pipelines that feed the dashboards, requiring stronger software engineering and cloud skills
The decision point usually arrives around the 2–4 year mark. Analysts who spend that window deepening Python and statistics tend to move toward Data Science; those who deepen SQL, cloud platforms, and pipeline tools tend to move toward Data Engineering; those who deepen business strategy and stakeholder management tend to move into Analytics Manager or BI leadership roles.
Choosing consciously rather than drifting is what separates candidates who reach senior roles by year five from those still doing entry-level work with more experience on paper.
IQLancer Data Analyst Readiness Checklist
Before applying broadly, use this checklist as an honest self-audit rather than a formality most candidates overestimate their readiness in exactly the areas recruiters test hardest.
| Area | Importance | Self-Assessment |
|---|---|---|
| SQL | High | |
| Excel | High | |
| Power BI/Tableau | High | |
| Portfolio Projects | High | |
| GitHub Portfolio | Medium | |
| Communication Skills | High | |
| Resume Quality | High | |
| Interview Readiness | High |
How to use this checklist: Rate yourself honestly on each row as Strong, Developing, or Weak not based on course completion, but based on whether you could perform that skill live in front of an interviewer today. Any “High Importance” row marked Weak is a priority area to fix before applying broadly, because it’s likely to end your candidacy at the exact stage of the interview process where that skill gets tested. Revisit this checklist every 4–6 weeks during your preparation; readiness for this role builds incrementally, not overnight.
Final Thoughts
Learning how to become a data analyst isn’t about collecting certificates; it’s about building the specific combination of SQL fluency, business judgment, and communication ability that recruiters test for at every stage of the hiring process.
The candidates who get hired aren’t necessarily the ones with the most credentials; they’re the ones who can prove their skills through real projects, explain their thinking clearly, and understand what each employer is actually evaluating. Certifications open doors, projects prove capability, and communication closes the gap in interviews.
As you move forward, focus your next few months on one thing at a time: strengthen SQL until you can query confidently live, build two to three projects with genuine business framing, and practice explaining your work to someone outside the field. That combination not a longer list of tools is what makes a candidate competitive for 2026-2027 and beyond.
People Ask Question
Can a non-technical student become a Data Analyst?
Yes. Many Data Analysts come from commerce, economics, finance, mathematics, and business backgrounds.
Is SQL mandatory for Data Analysts?
SQL is one of the most frequently requested skills in Data Analyst job descriptions and is considered essential for most roles.
How many projects should a Data Analyst have?
Most entry-level candidates should aim for at least 4-6 strong projects that demonstrate analytical and business problem-solving abilities.
Is Python required for Data Analysts?
Not always. Many entry-level roles focus on Excel, SQL, and Power BI, though Python can improve career growth opportunities.
What is the average Data Analyst salary in India?
Salaries vary based on skills, location, industry, and experience, with entry-level roles generally starting lower and increasing with expertise.
2 thoughts on “How to Become a Data Analyst: Skills, Projects, Salary & Career Path”